Thursday, 30 July 2026

NASA Awards 2026 Innovative Technology Concepts

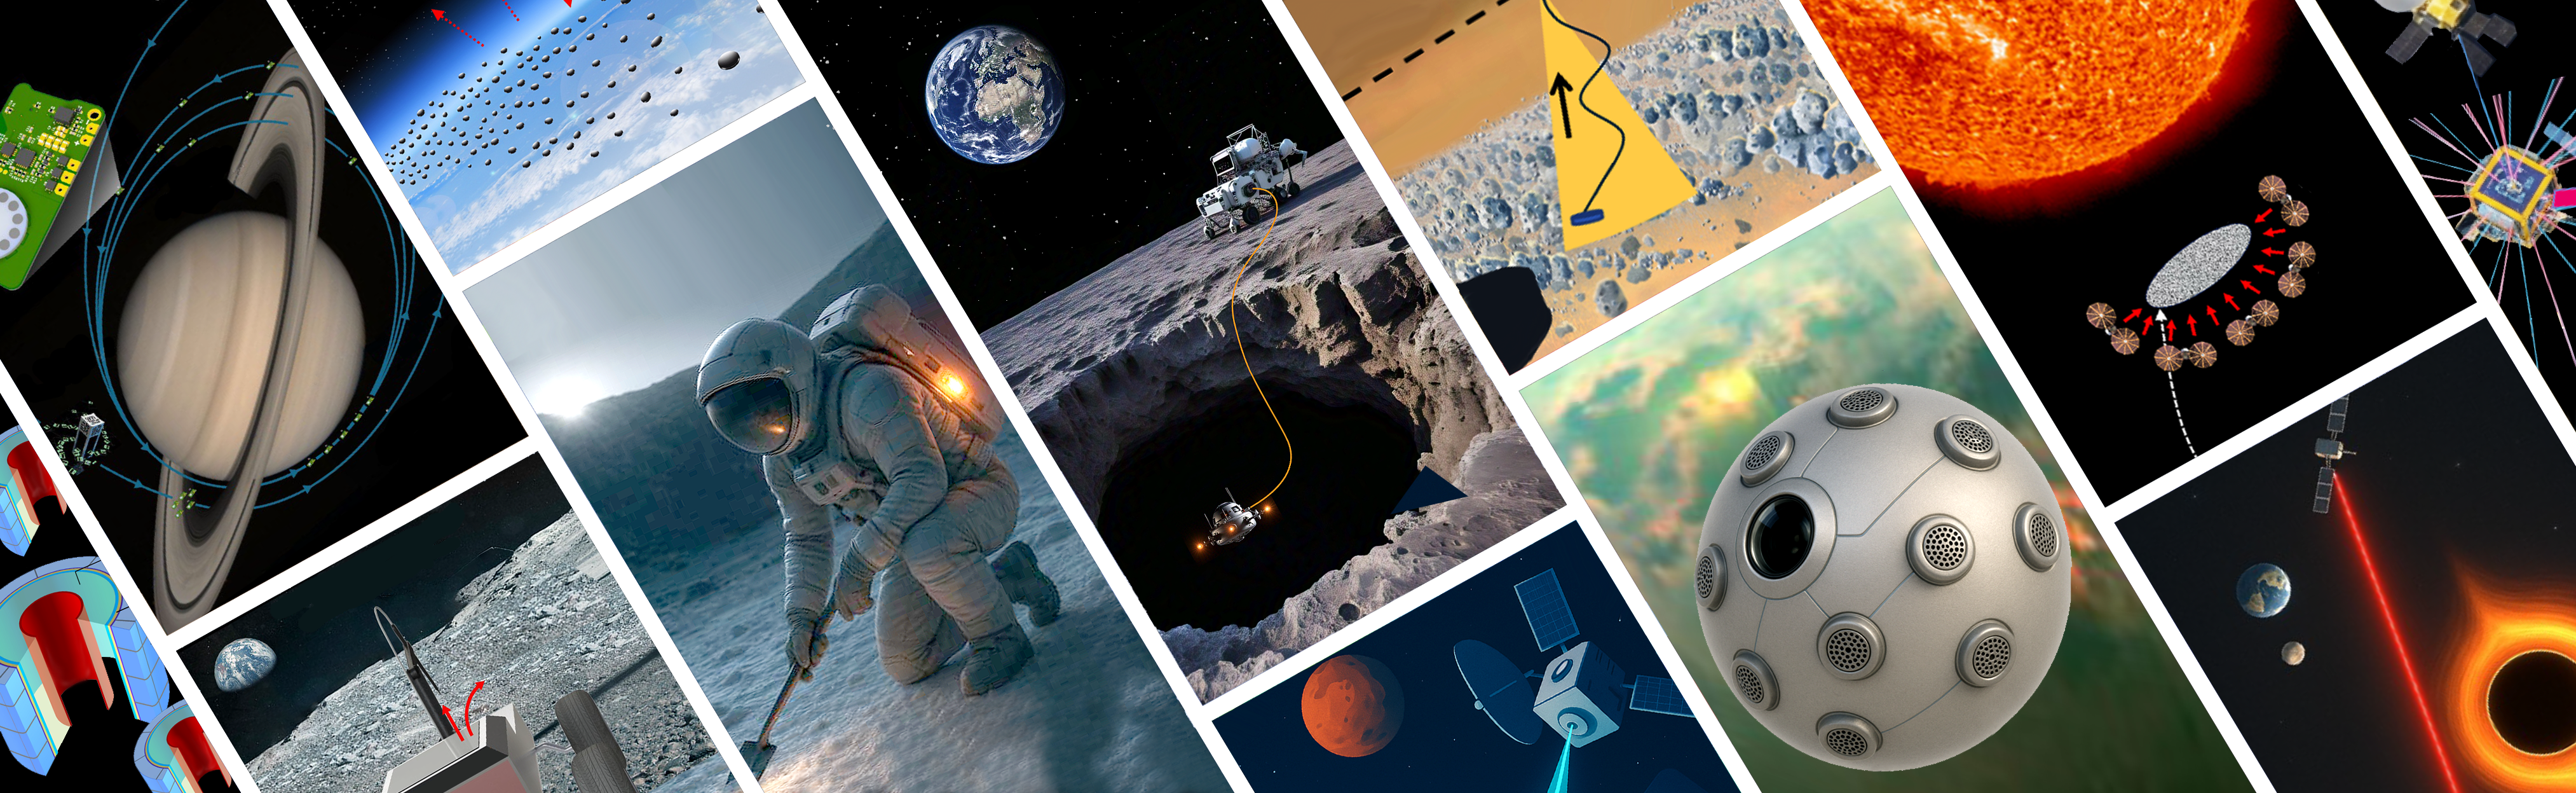
A collage of artist concepts highlighting the novel approaches proposed by the 2026 NIAC awardees.
Credit: NASA

The NASA Innovative Advanced Concepts (NIAC) program has created 18 new awards to support visionary ideas to improve aerospace technologies in areas ranging from the exploration of the solar system to understanding the universe.

The 18 NIAC Phase I awards total $3.2 million. Each award provides up to $175,000 for a nine-month initial investigation. The NIAC projects are about early-stage concept development and are not considered official NASA missions.

“NASA has outlined an ambitious vision for the future of space exploration, we’re returning the Moon to stay, advancing to Mars, and pushing to deepen our understanding of space,” said Greg Stover, director of the Advanced Research and Technology division within the Research and Technology Mission Directorate at NASA Headquarters in Washington. “Achieving that will require more than incremental technological advancement. It means we need great leaps. These awards are the kinds of innovation the world needs NASA to help foster.”

As an innovation incubator, NIAC funds early development of potential breakthrough technologies. Concepts for award consideration must have both transformative potential and possible feasibility for eventual implementation.

“Every innovation, every leap in technology, starts with a seed of an idea,” said Phillip Williams, NIAC’s acting program executive. “The NIAC program allows NASA to germinate those seeds and determine if there’s something that could be grown to benefit future space missions and our nation’s aerospace economy.”

As NASA and its partners push for sustained lunar presence, some of the 2026 awardees focused on ways to help explore the Moon and build infrastructure there. These include a system to support hovering robots to explore lava tubes under the Moon’s surface, a method to manage temperatures for small mobile exploration robots, and a way to incorporate radioisotopic heat sources into suits to help keep astronauts warm when operating in the Moon’s nearly two-week-long lunar nights.

Other concepts focus on exploring some of the solar system’s most remarkable features. Venus, with its hot atmosphere, presents an imposing challenge for research vehicles, so one NIAC awardee explores methods for hardening instruments for longer missions.

Two other concepts could help study planetary rings. One would use a swarm of 10,000 tiny satellites to map and analyze the rings of Saturn, while another would create a system for collecting samples from rings such as those circling Saturn, Uranus, and Neptune.

Some NIAC awardees will look far beyond the solar system, exploring ways to power interstellar spacecraft, map out continents on exoplanets, observe the photon rings around black holes, and detect subtle gravitational waves to explain how galaxies formed. Others will work to answer questions directly related to life on Earth, like the potential use of spaceborne dust to reduce solar radiation, and awareness about the debris orbiting Earth.

Researchers, known as NIAC Fellows, will investigate their concepts and identify potential challenges and opportunities for further development.

The 18 selections for 2026 NIAC Phase 1 grants are:

  • Saptarshi Bandyopadhyay, NASA Jet Propulsion Laboratory, Pasadena, California: Dimming the Sun Using Controllable Dust Cloud to Reduce Solar Insolation (DimSun)  
  • David Bugby, NASA Jet Propulsion Laboratory: Combinatory Architecture offering Neomobility, on-Venus Adaptability, and Survivability (CANVAS)
  • A.C. Charania, Zeno Power Systems, Inc., Washington:
    Extended Astronaut Radioisotope-EVA in Nighttime and Deep-space Icy Landscapes (EARENDIL)
  • Anish Damodaran, University of Central Florida, Orlando: PS21: Transforming Submillimeter Space Interferometry with Photonic Technologies
  • Artur Davoyan, University of California, Los Angeles: Coilable Stacked Solar Sails for Very High delta-V Missions
  • Daniel Drew, University of Hawaii, Honolulu: Solid-state Propulsion for Autonomous Reconnaissance of Karst (SPARK)
  • Gilly Elor, Stone Aerospace, Inc., Del Valle, Texas: Power-over-Fiber to Enable a Lunar Underground eXplorer (LUX)
  • Zhaoyan Liu, NASA Ames Research Center, California’s Silicon Valley: Quantum Wind Lidar Applications for Planetary and Earth Science Missions
  • Jeff Nosanov, Orbital Velocity, LLC, Decatur, Georgia: OBLIVIAN: Observing Black hole LIght Via Intensity cOrrelatioN (OBLIVIAN)
  • Keunhan Park, University of Utah, Salt Lake City: Plasmon-Enhanced Radioisotope Thermophotovoltaic (PRTPV) Power Generation for Interstellar Missions
  • Austin Phoenix, Virginia Polytechnic Institute and State University, Blacksburg, Virginia: Efficient variable Conductivity Lunar Insulator for Passive Surveyor Environmental Control (ECLIPSE)
  • Marco Quadrelli, NASA Jet Propulsion Laboratory: PRAXIS: Planetary Rings Autonomous EXploration with In-situ Sampling (PRAXIS)
  • Michael Rubenstein, Northwestern University, Chicago: Actively Steerable Femtosat Constellations for In-situ Exploration of Saturn’s Rings, Atmosphere, and Magnetosphere
  • Benjamin Schafer, Rarefied Technologies Inc., Albuquerque, New Mexico: : Photophoretic Tracers for Near-Space Remote Sensing at 30-100 km Altitudes
  • David Smith, Duke University, Durham, North Carolina: Robotically Assembled Electromagnetic Metamaterials for Long-Range Space Situational Awareness
  • Pablo Sobron, Search for Extraterrestrial Intelligence Institute, Mountain View, California: Interworld Slingshot Resource Surveys
  • Paul Stankus, Brookhaven Science Associates, Upton, New York: Mapping Alien Continents: Achieving Optical VLBI for Exoplanet Imaging
  • Paul Stankus, Brookhaven Science Associates, Upton, New York: Precision Astrometry Using Optically Independent Spacecraft for Gravitational Wave Detection

To learn more about NASA’s NIAC program, visit:

https://www.nasa.gov/about-niac

-end-

Rob Margetta
Headquarters, Washington
202-358-0918
robert.j.margetta@nasa.gov 

Share

Details

Last Updated
Jul 29, 2026
Editor
Jennifer M. Dooren


from NASA https://ift.tt/jKfq42D
Wednesday, 29 July 2026

Understanding How Martian Auroras Are Made

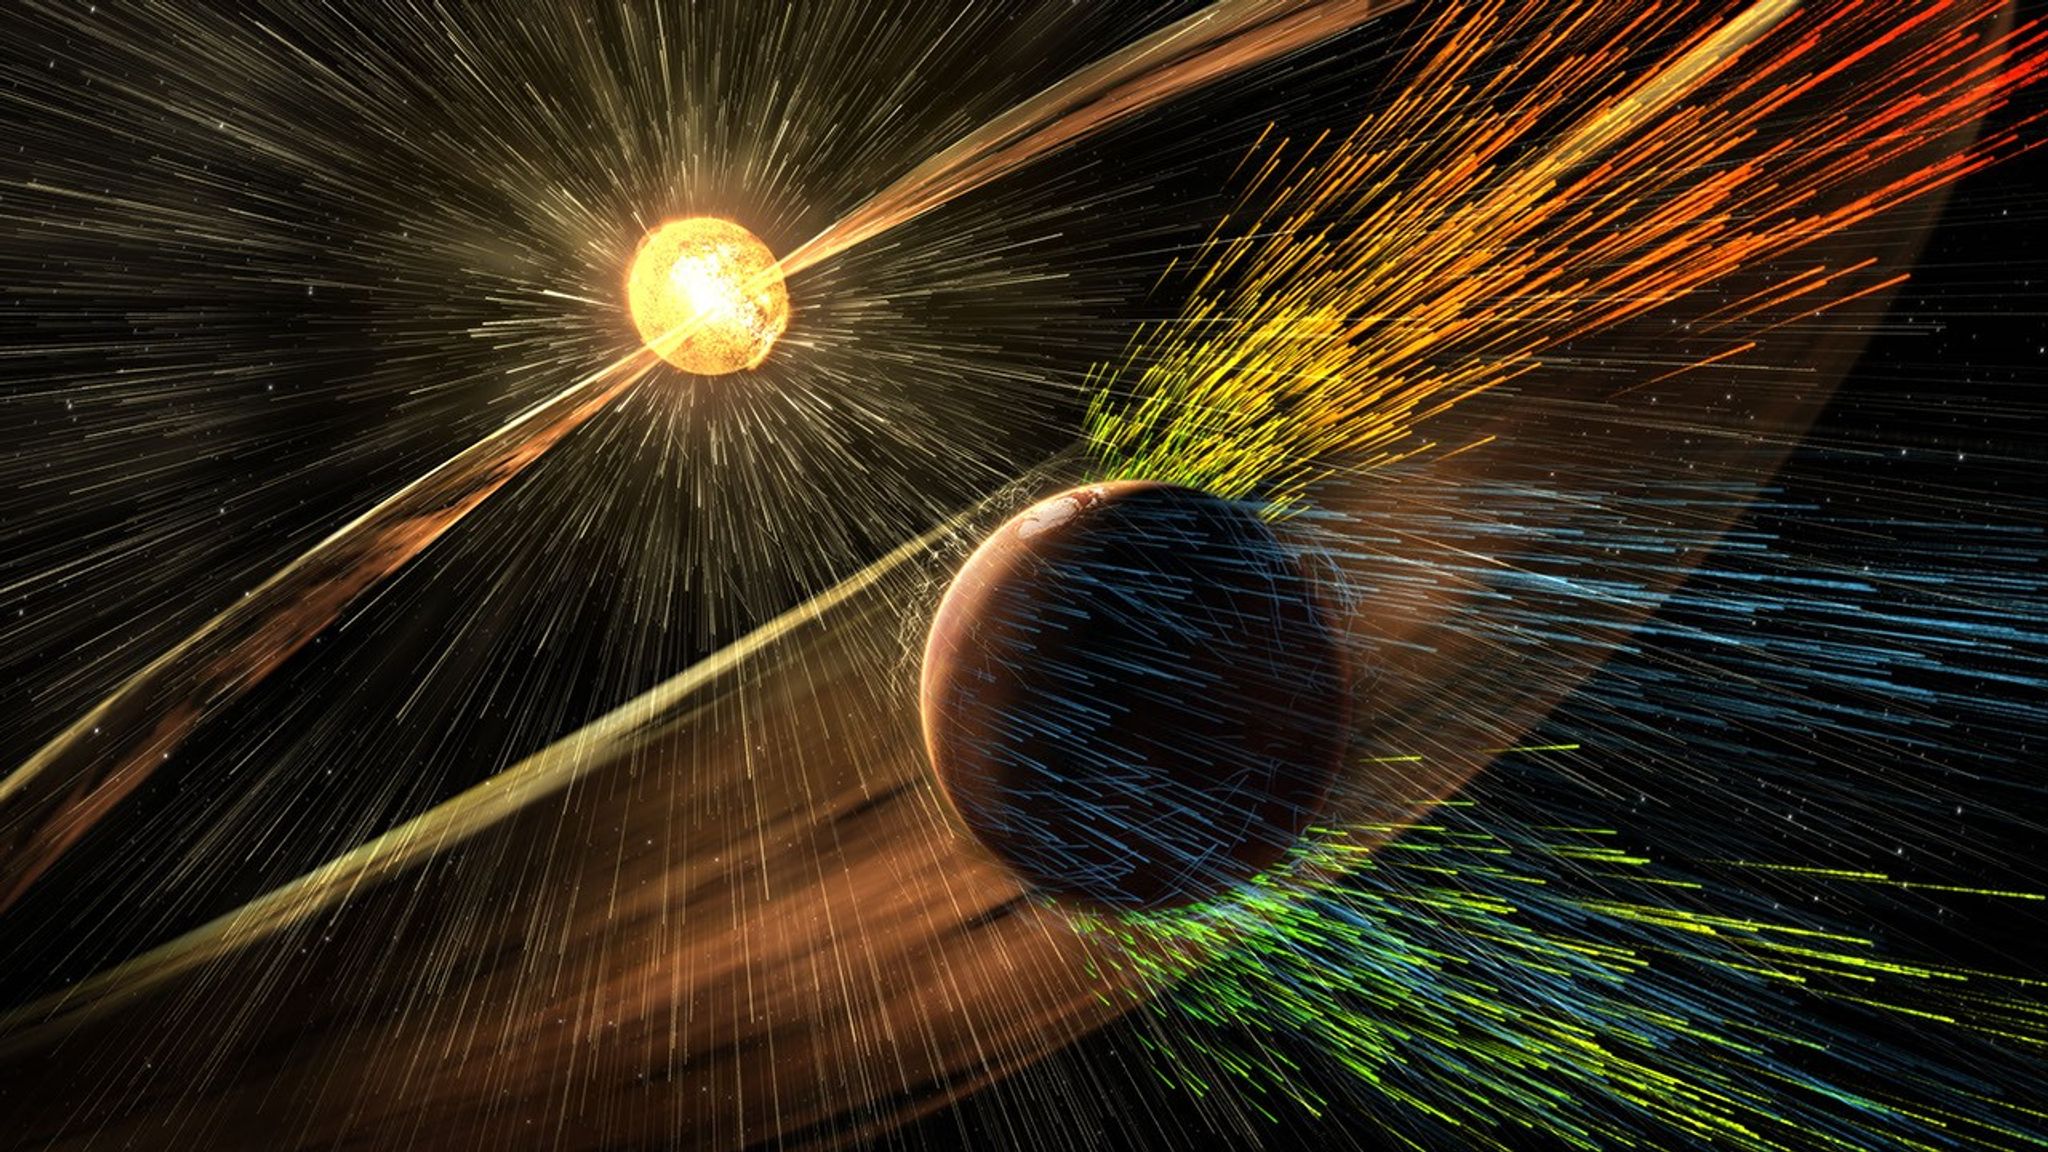
In this illustration, yellow charged particles from the Sun strip off rainbow-colored charged particles from Mars (in the foreground). The Martian particles stream away from the planet, toward the viewer and off to the right of the image. The Sun illuminates the far side of Mars.
NASA

This July 23, 2026, illustration depicts charged particles from a solar storm stripping away charged particles of Mars’ atmosphere, one of the processes of Martian atmosphere loss studied by NASA’s MAVEN (Mars Atmosphere and Volatile Evolution) mission. NASA MAVEN mission scientists have found that certain types of auroras on Mars form in a similar way to Earth-based auroras.

Read more about this discovery.

Image credit: NASA


from NASA https://ift.tt/m91kxNn

NASA Webb Explores Family Tree of Newly Discovered Distant Objects

7 Min Read

NASA Webb Explores Family Tree of Newly Discovered Distant Objects

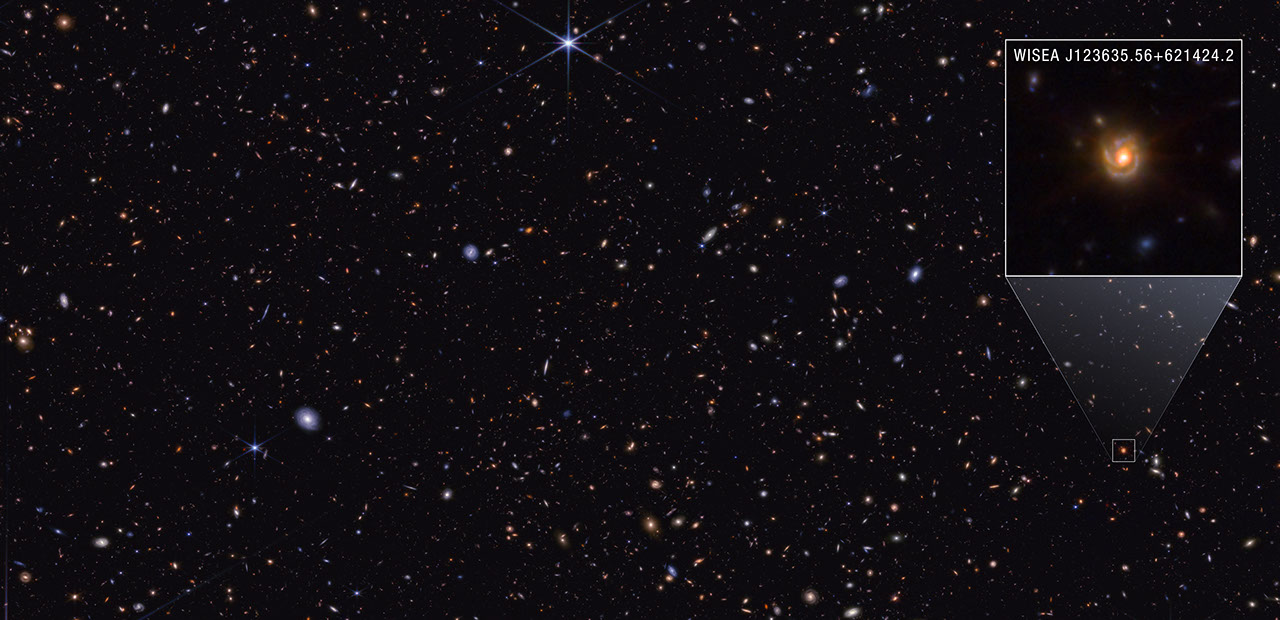
A rectangular image with thousands of galaxies of various shapes and colors on the black background of space. Some are noticeably spirals, either face-on or edge-on, while others are blobby ellipticals. Many are too small to discern any structure. One prominent foreground star at top center features Webb’s signature 8-point diffraction spikes. At upper right, a box shows a zoomed in portion of the image. The pullout features a spiral galaxy labeled “WISEA J123635.56+621424.2.” The galaxy has a bright yellow center and faint brown arms speckled with regions of blue that appear to wind clockwise around the galaxy’s core.
Scientists have proposed one pathway little red dots can follow as the universe matures based on their analysis of spiral galaxy WISEA J123635.56+621424.2, nicknamed the “Saguaro.” They suggest little red dots may be a temporary phase of highly active supermassive black holes.
Credits:
Image: NASA, ESA, CSA, STScI, Pierluigi Rinaldi (Steward Observatory); Image Processing: Alyssa Pagan (STScI)

Since their discovery by NASA’s James Webb Space Telescope in 2022, little red dots (LRDs) have been the subject of great interest to astronomers. Understanding the nature of these extremely distant, compact red sources has been a puzzling scientific endeavor.

One popular theory is that little red dots are supermassive black holes known as active galactic nuclei, although they display characteristics unlike nearby active galactic nuclei. While they appear abundant at high redshift early in the universe, they rapidly decrease in number at lower redshifts. (The higher the redshift, the greater the distance the light has traveled across the universe.) This perplexing shift in number raises the question: What happens to little red dots as the universe matures?

A team of researchers led by Pierluigi Rinaldi of the University of Arizona’s Steward Observatory, now at the Space Telescope Science Institute (STScI) in Baltimore, has built upon their previous research in a new study published on July 29 in The Astrophysical Journal and proposed one pathway LRDs can follow as the universe ages: Though they may look like a unique galaxy population, these dots are affected by observational bias — some features just don’t appear at higher redshifts with current technology.

Image: Saguaro in GOODS-North Field (NIRCam)

A rectangular image with thousands of galaxies of various shapes and colors on the black background of space. Some are noticeably spirals, either face-on or edge-on, while others are blobby ellipticals. Many are too small to discern any structure. One prominent foreground star at top center features Webbu2019s signature 8-point diffraction spikes. At upper right, a box shows a zoomed in portion of the image. The pullout features a spiral galaxy labeled u201cWISEA J123635.56+621424.2.u201d The galaxy has a bright yellow center and faint brown arms speckled with regions of blue that appear to wind clockwise around the galaxyu2019s core.
Scientists have proposed one pathway little red dots can follow as the universe matures based on their analysis of spiral galaxy WISEA J123635.56+621424.2, nicknamed the “Saguaro.” They suggest little red dots may be a temporary phase of highly active supermassive black holes.
Image: NASA, ESA, CSA, STScI, Pierluigi Rinaldi (Steward Observatory); Image Processing: Alyssa Pagan (STScI)

Their conclusions are based on their analysis of lower-redshift spiral galaxy WISEA J123635.56+621424.2, nicknamed the “Saguaro” for its prominent arms, like the cactus native to the Sonoran Desert in the Southwestern United States. A particularly intriguing feature of this redshift 2 galaxy, which corresponds to approximately 3.3 billion years after the big bang, is its little red dot-like center that is reminiscent of the ruby red fruit produced by the desert plant.

“Everything created in the early universe must evolve into something around us. We have had little idea of what LRDs become, but these results finally show us how to find their progeny,” said co-author George Rieke of the University of Arizona. Previous studies by NASA’s retired Spitzer Space Telescope provided the first hint of the dust-obscured, compact galaxy population in the lower-redshift universe that the Saguaro belongs to, paving the way for NASA’s Hubble and James Webb space telescopes’ high-resolution analyses.

“The Saguaro is important because it’s a prototypical little red dot and is one of the few we have found at lower redshift. It can be used to study the pathway of these dots throughout cosmic time,” said Fabio Pacucci of the Harvard-Smithsonian Center for Astrophysics in Cambridge, Massachusetts, and a co-author of the study.

Among the thousands of sources Rinaldi looked at across several surveys, the Saguaro was an example of the right place — with one of Webb’s microshutter arrays perfectly framed over the galaxy’s core to take spectroscopic data — and right time — being at lower redshift. To get as broad a view of the spiral galaxy as possible across the electromagnetic spectrum, the team used Hubble’s ultraviolet- and Webb’s infrared-imaging and spectroscopic archival data, respectively.

“Because the Saguaro is at lower redshift, we can see the very beautiful and bright host galaxy in high resolution and detail with Webb and Hubble,” said Zihao Wu of the Harvard-Smithsonian Center for Astrophysics, and a co-author of the study. “Webb’s observations can help us understand how the galaxy and its little red dot-like nucleus are connected.”

The team took multiple approaches to verify that the Saguaro’s compact red nucleus matched the characteristics of a prototypical LRD. In particular, the Hubble and Webb data showed that the nucleus is brighter in both ultraviolet and infrared light than in visible light, just like distant LRDs. The team also carefully disentangled the light emitted from the host and nucleus, and considered the presence of X-ray emission from the source.

Although the majority of little red dots at high redshift are not detectable in X-ray light, NASA’s Chandra X-ray Observatory detected weak X-ray emission from the Saguaro.

“What the X-ray light observations show is that this galaxy has an active galactic nucleus, and a very obscured one at that,” said Carys Gilbert, a Master’s student at the University of Cape Town in South Africa and a co-author of the paper. “It’s not only obscured but also X-ray weak. That kind of combination could explain the lack of X-ray emission that we see from all other little red dots. It fits the puzzle of little red dots nicely.”

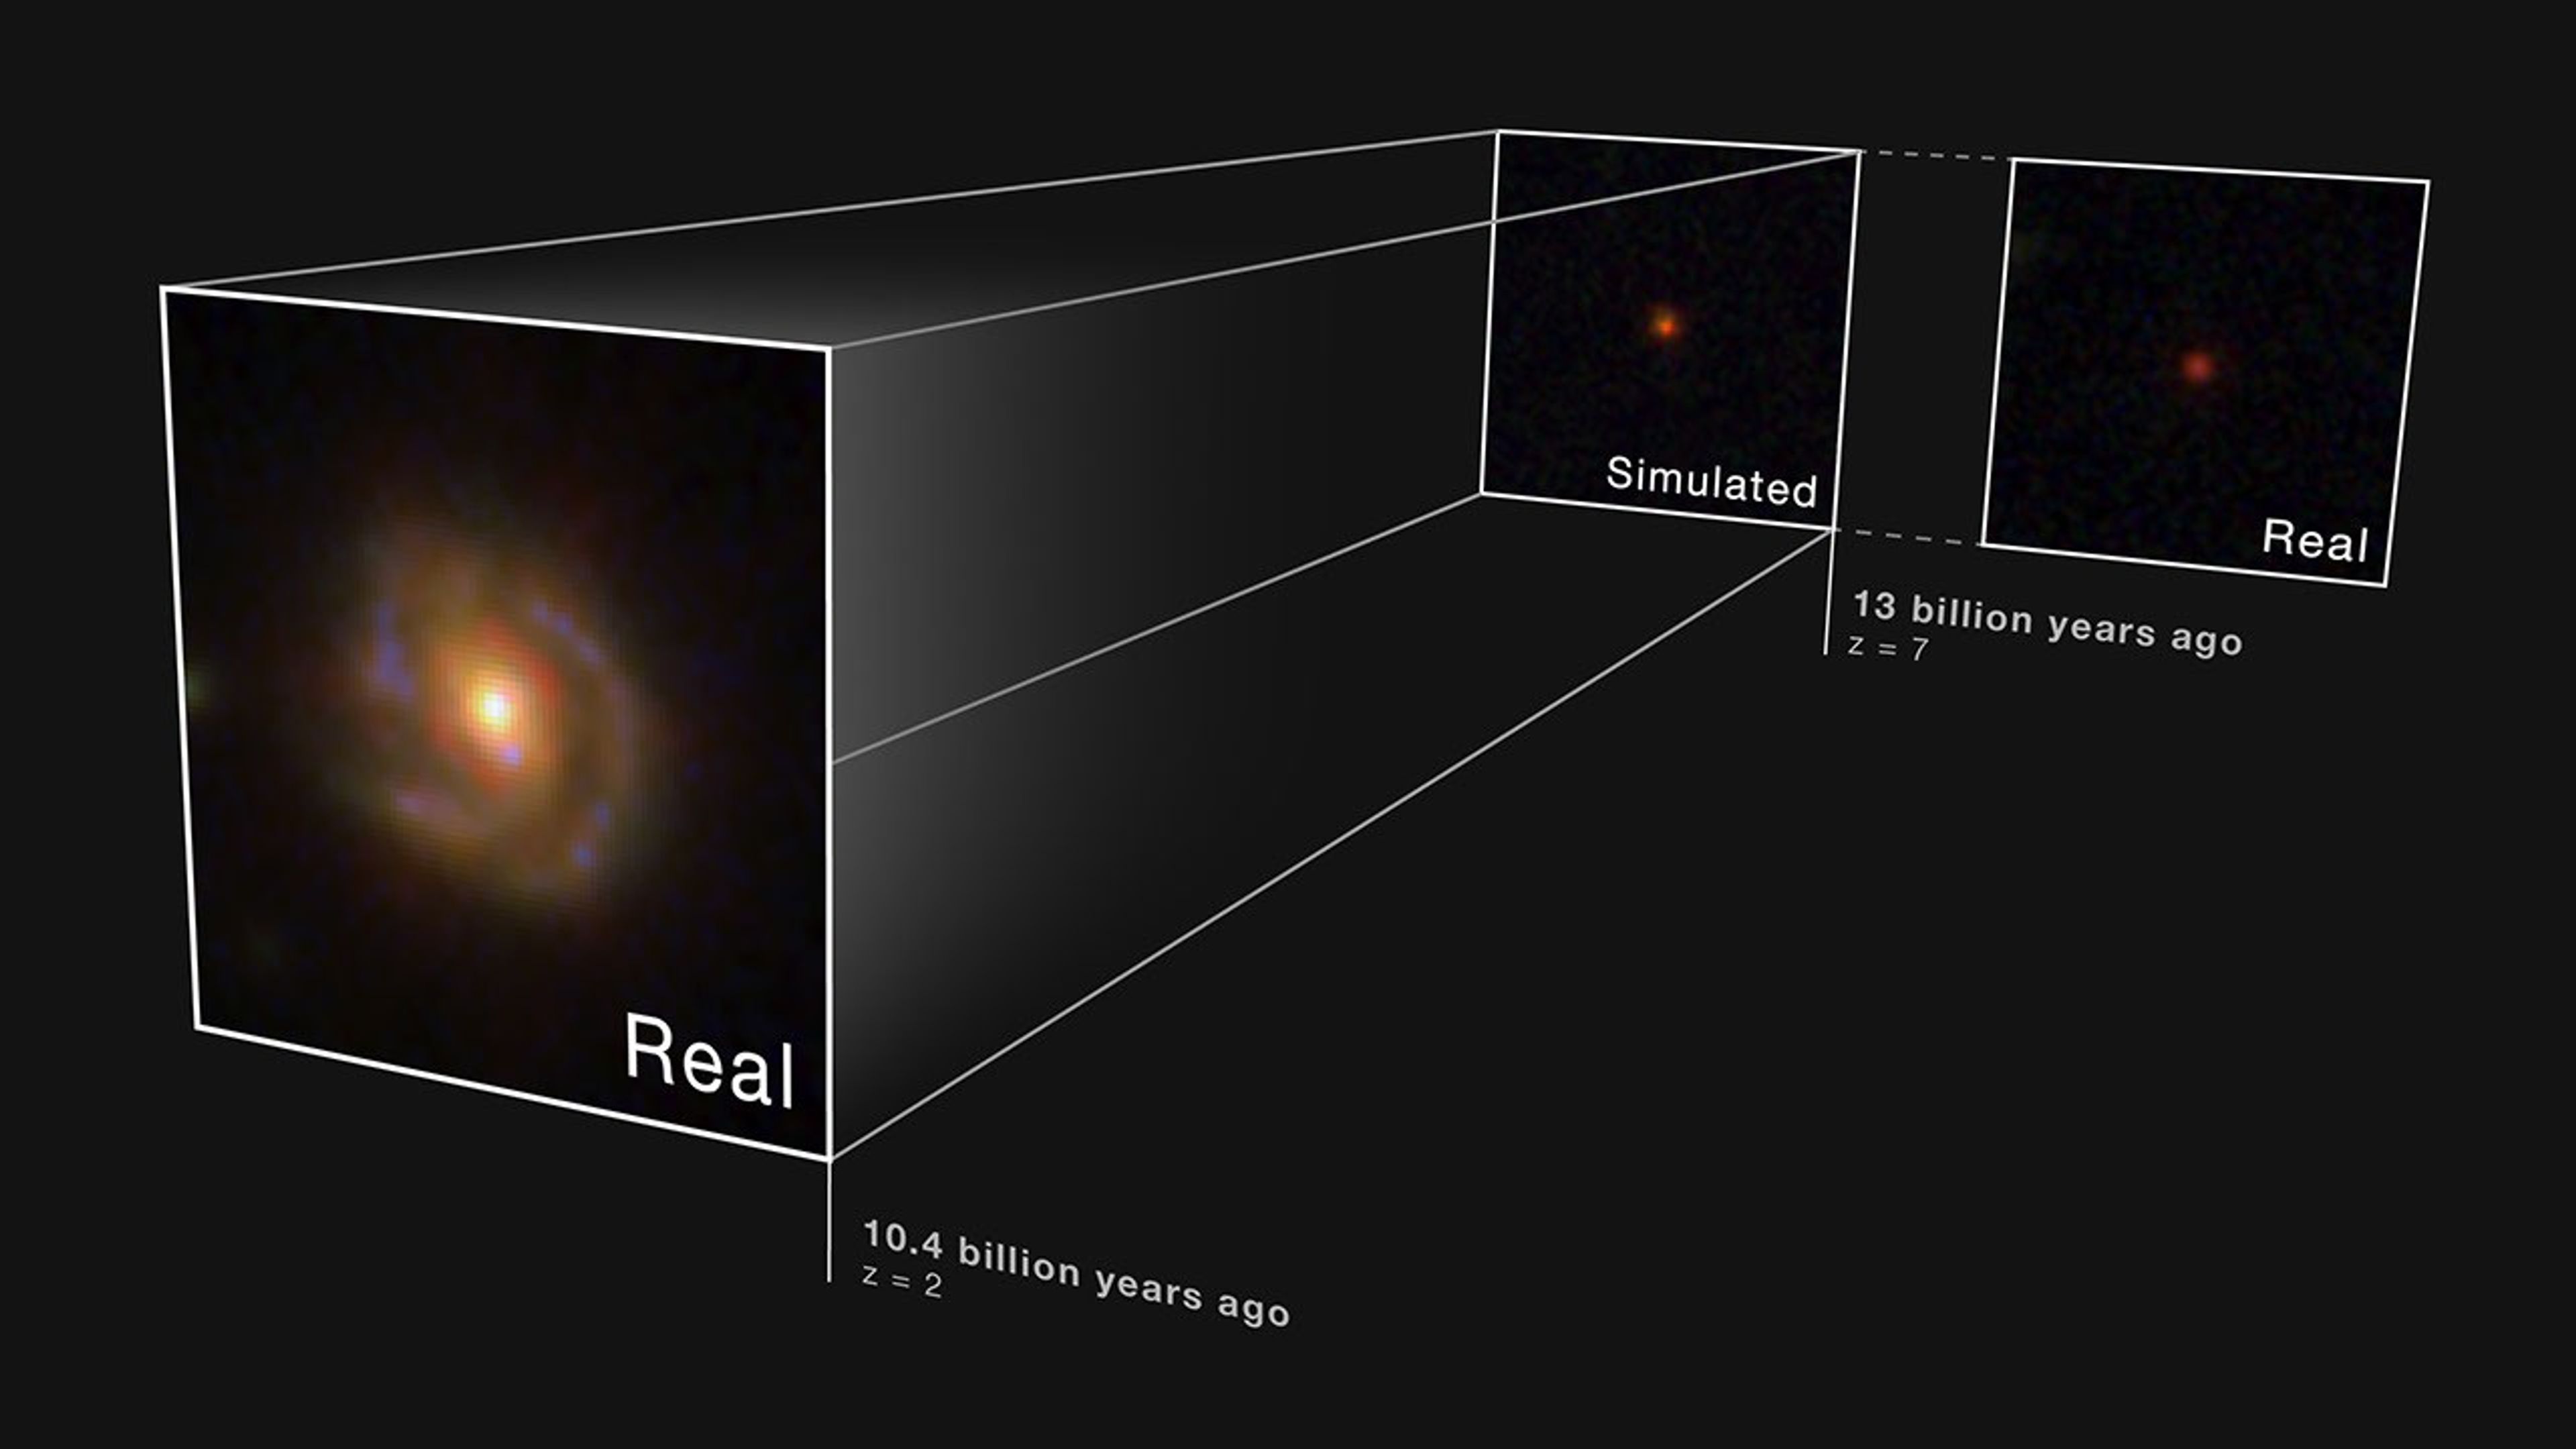
In addition to demonstrating how the Saguaro’s central compact red source fits the little red dot criteria, the team synthetically shifted the galaxy to a higher redshift to explore how this galactic environment would appear to observers if located in the early universe. As expected, the Saguaro’s surrounding galactic structure fades so that only the bright, LRD-like source at its center is visible.

“Our theory is that most of these distant sources are affected by this cosmological effect, creating an observational bias,” said Rinaldi. “We simply are not able to sample the immediate environment of high-redshift little red dots because their surroundings are just too faint to be observed even with Webb. Little red dots are far more complex than just being a dot. They’re just the tip of the iceberg — of a supermassive black hole interacting with its nearby surroundings.”

Image: Little Red Dot at Redshift 2: Real and Simulated Graphic

Three squares angled slightly toward the left against a black background. The largest square is at left with a large hazy spiral galaxy in its center. The galaxy has a bright yellow center and faint brown arms speckled with regions of blue that appear to wind clockwise around the galaxy’s core. Text near the bottom of the square reads: Real, 10.4 billion years ago, z = 2. A set of two smaller squares appear near the top right. Each small square shows a small hazy red dot in the center against a black background, with the little red dot in the small left square a bit brighter than the dot in the right square. The small square on the left is labeled: Simulated, 13 billion years ago, z = 7. The small square on the right is labeled: Real. A set of lines connects the large square with the spiral galaxy and the simulated little red dot in the small square.
Scientists synthetically shifted the Saguaro, a lower-redshift spiral galaxy, to a higher redshift to find out how it would appear if it was in the early universe. Its compact red appearance suggests that little red dots are a phase of highly active supermassive black holes.
Image: NASA, ESA, CSA, Pierluigi Rinaldi (Steward Observatory); Image Processing: Alyssa Pagan (STScI); Illustration: Leah Hustak (STScI)

Considering the Saguaro case study, the team believes that LRDs may not be a unique galaxy population, but instead a temporary phase of highly active supermassive black holes. Could this theory be the link between the populous high-redshift little red dots seen by Webb and the local universe?

While the Saguaro is not representative of all LRDs, the team proposes that this is one phase of these compact red sources. To build more confidence, further study of the Saguaro is necessary, as well as seeking other Saguaro-like galaxies at lower redshift. The team also intends to comb through Webb’s bountiful archival data to build a census of little red dots to study how their environments may impact how they mature. These different approaches are all geared to helping uncover the family tree of little red dots.

The James Webb Space Telescope is the world’s premier space science observatory. Webb is solving mysteries in our solar system, looking beyond to distant worlds around other stars, and probing the mysterious structures and origins of our universe and our place in it. Webb is an international program led by NASA with its partners, ESA (European Space Agency) and CSA (Canadian Space Agency).

The Hubble Space Telescope has been operating for over three decades and continues to make ground-breaking discoveries that shape our fundamental understanding of the universe. Hubble is a project of international cooperation between NASA and ESA (European Space Agency). NASA’s Goddard Space Flight Center in Greenbelt, Maryland, manages the telescope and mission operations. Lockheed Martin Space, based in Denver, also supports mission operations at Goddard. The Space Telescope Science Institute in Baltimore, which is operated by the Association of Universities for Research in Astronomy, conducts Hubble science operations for NASA.

To learn more about Webb, visit:

https://science.nasa.gov/webb

To learn more about Hubble, visit:

https://science.nasa.gov/hubble

Downloads & Related Information

The following sections contain links to download this article’s images and videos in all available resolutions followed by related information links, media contacts, and if available, research paper and Spanish translation links.

Related Links

Read more: Webb Science: Galaxies Through Time

Read more: Galaxies Over Time

Explore more: ViewSpace: Connecting Little Red Dots

Watch: Sonification of Gas Velocity Around a Supermassive Black Hole

Watch: JWST Science Simulations: Galaxy Formation

More Webb: News | Images | Science | Home Page


Share

Details

Last Updated
Jul 29, 2026

Contact
Media

Laura Betz
NASA’s Goddard Space Flight Center
Greenbelt, Maryland
laura.e.betz@nasa.gov

Abigail Major
Space Telescope Science Institute
Baltimore, Maryland

Hannah Braun
Space Telescope Science Institute
Baltimore, Maryland


from NASA https://ift.tt/Z7qN5bW

Contractor to Civil Servant: NASA Welcomes Ray Williams

Headshot of Ray Williams
Ray Williams, supervisor of test support operations at NASA’s Stennis Space Center near Bay St. Louis, Mississippi, poses for a photograph on July 16, 2026. Williams is among the first engineers and technicians sworn in as new NASA civil servants at Stennis as part of the administrator’s directive to strengthen technical core competencies within the civil service workforce.
NASA/Danny Nowlin

Ray Williams’ progression at NASA’s Stennis Space Center near Bay St. Louis, Mississippi, has uniquely prepared him for his new role.

As part of NASA’s plan to restore core competencies by converting contractors to civil service, the New Orleans native and Grambling State University graduate now works as a supervisor for test operations support at the agency’s E-Complex.

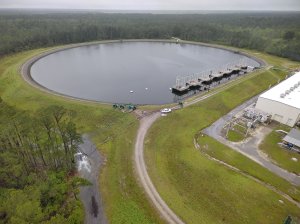
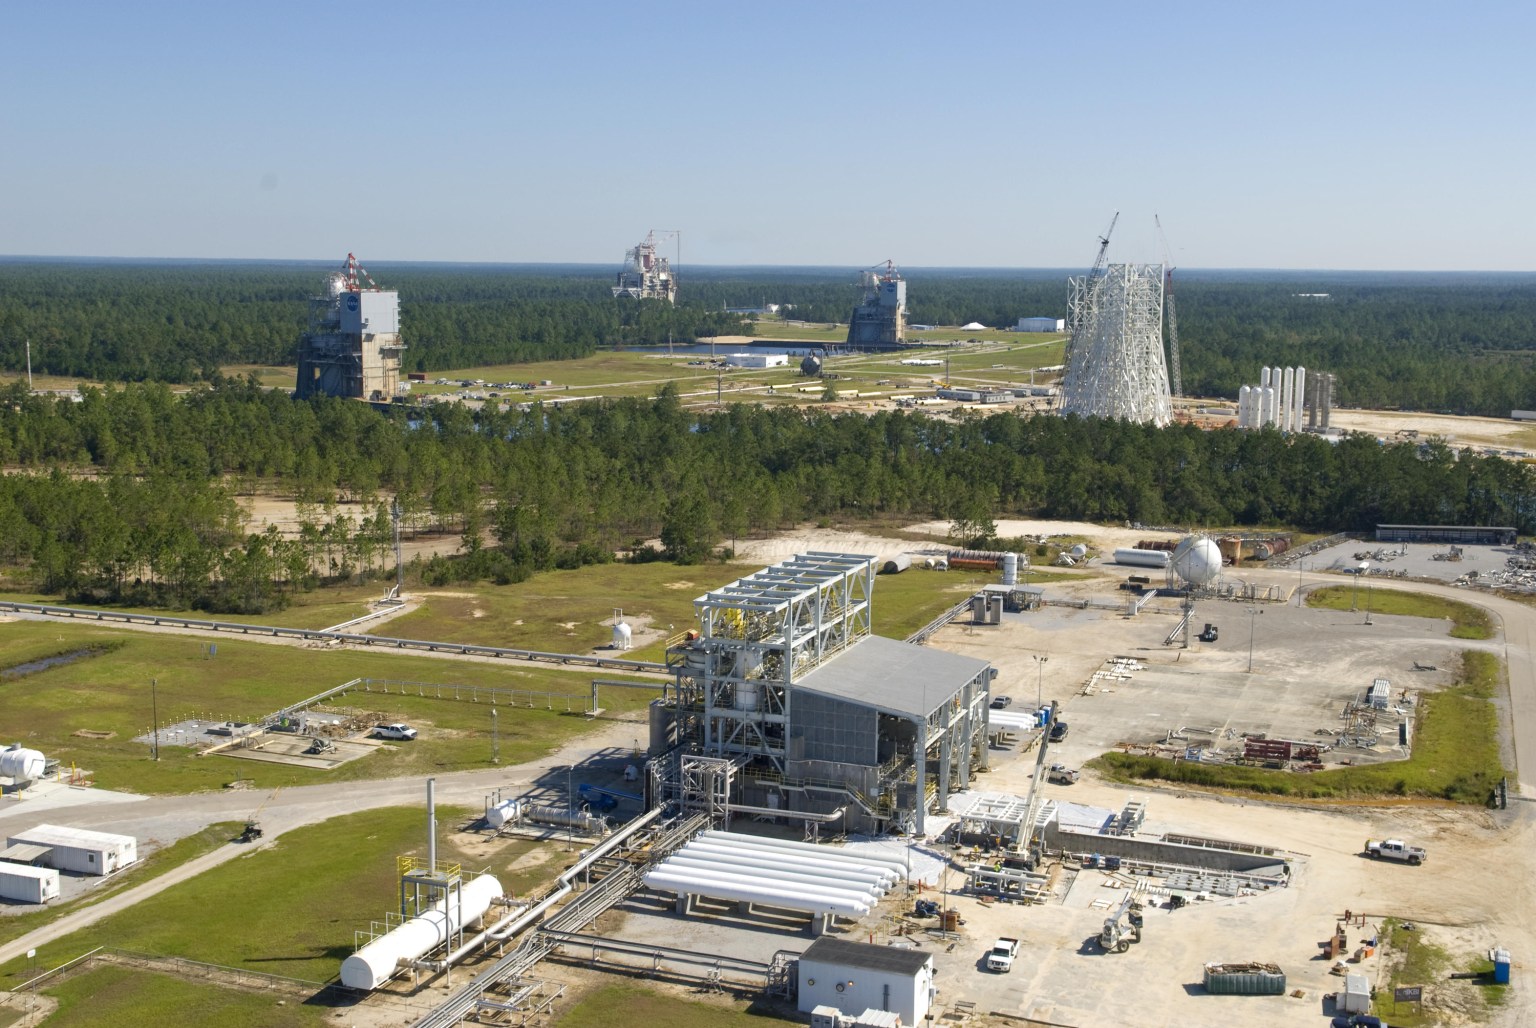
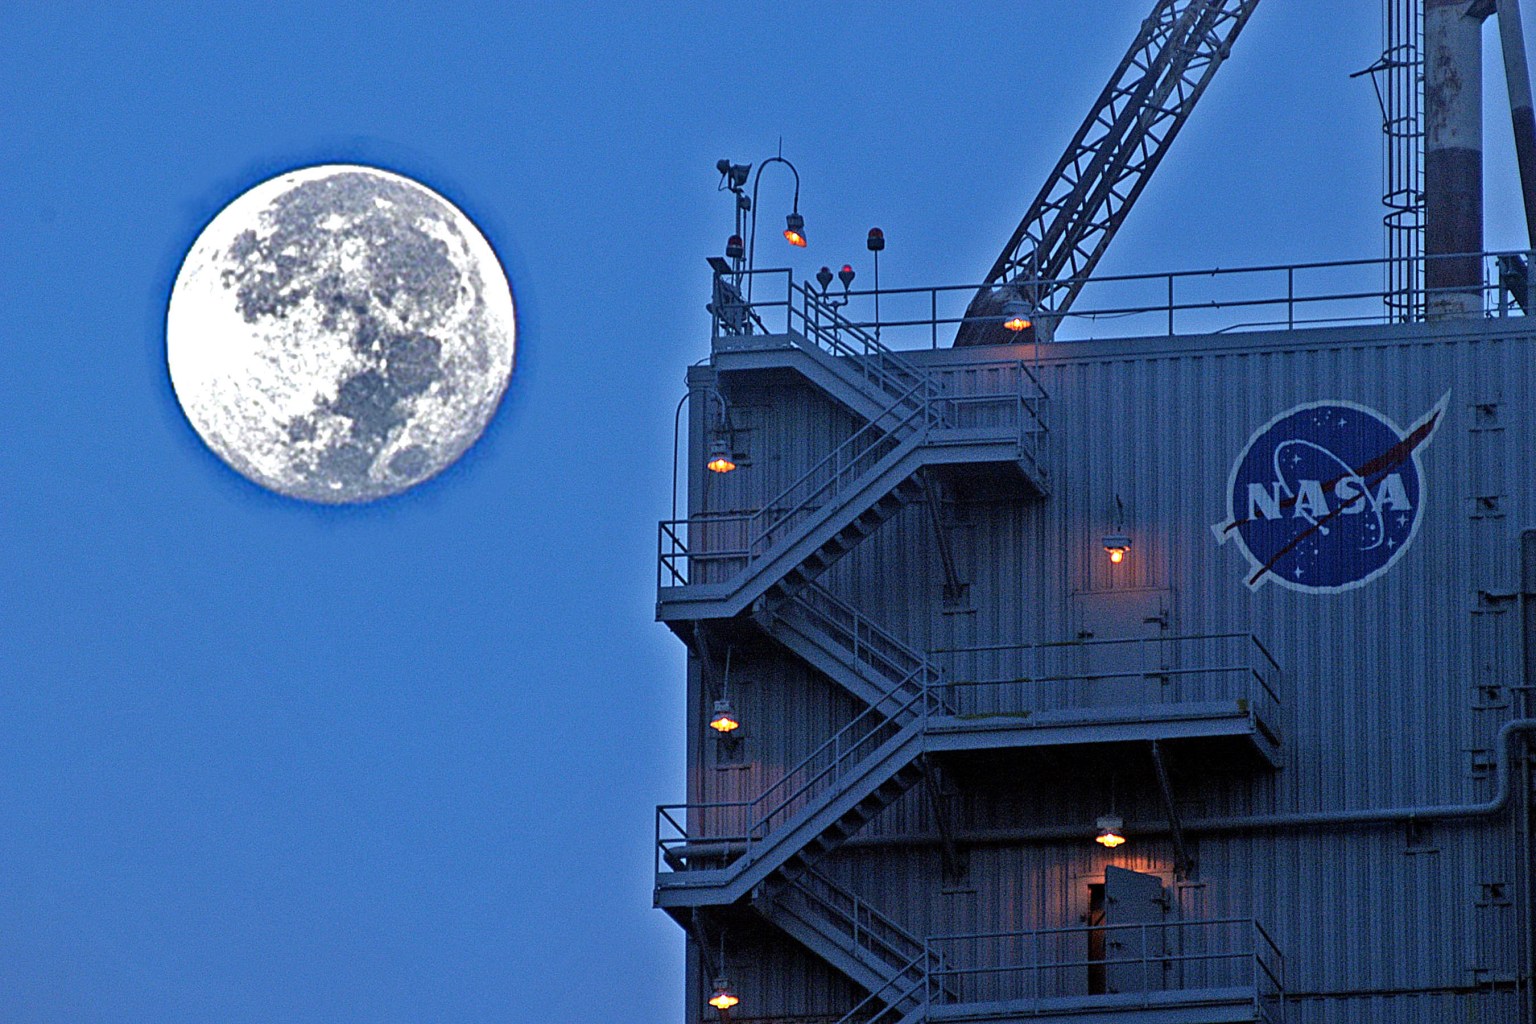
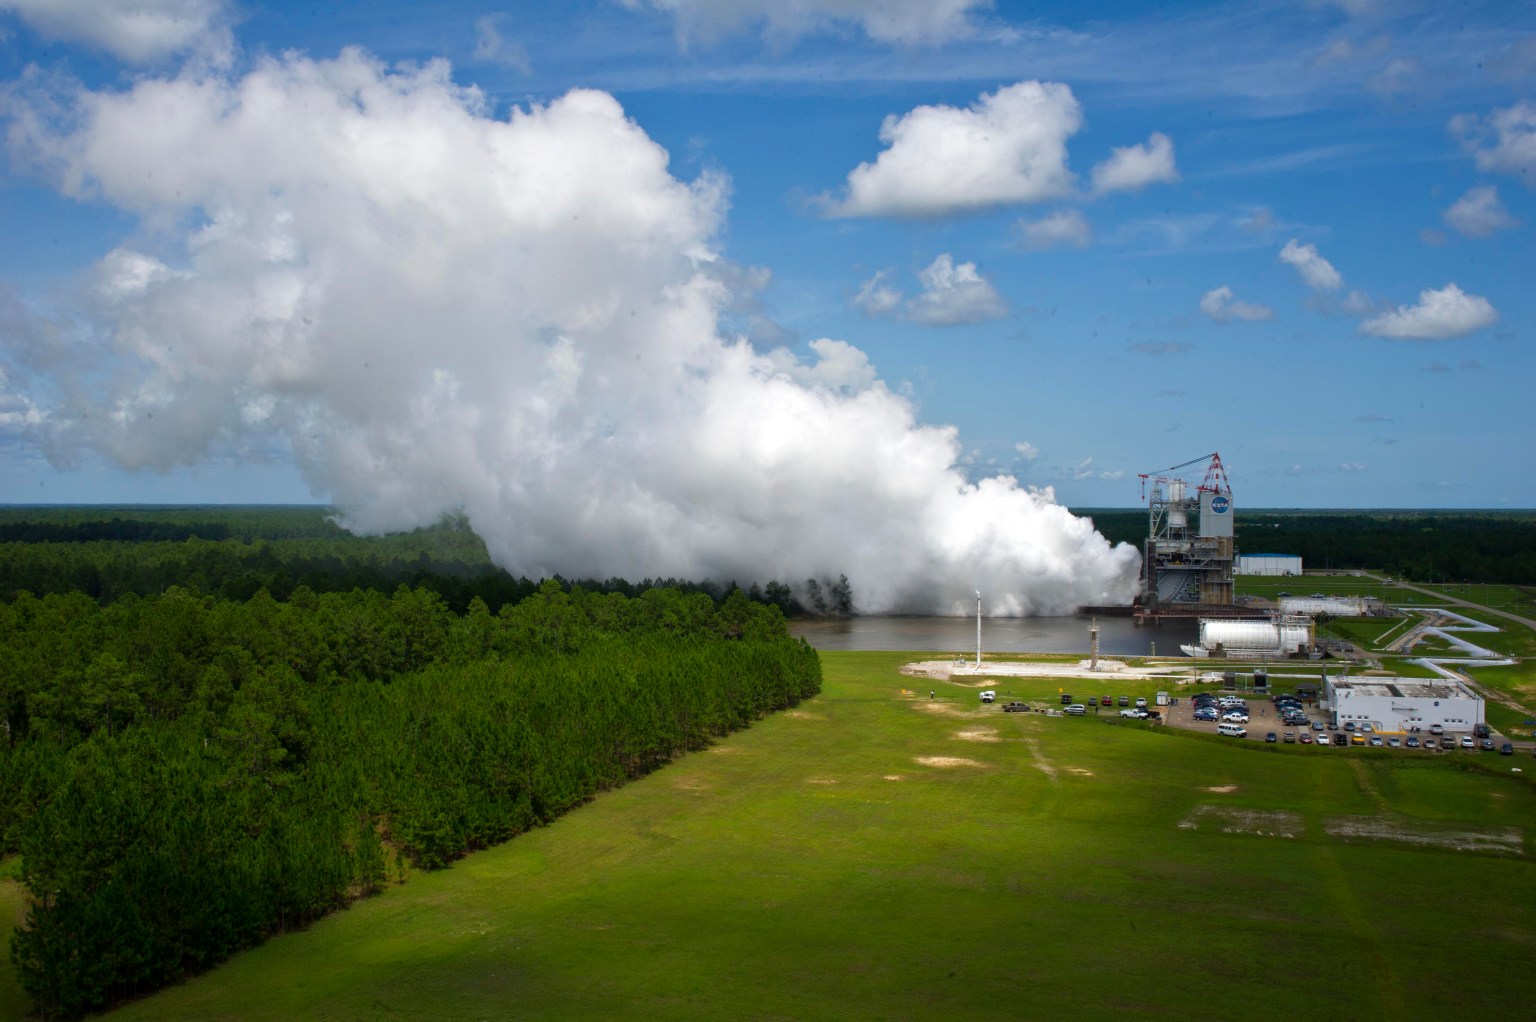
This propulsion testing facility provides mission-critical engineering capabilities to NASA. Through the use of high- and low-pressure propellant systems, engineers are able to focus on development testing of propulsion system components before integration into complete engine systems. Thanks to the versatility of its infrastructure and test team, the complex is uniquely equipped to support projects for the growing commercial aerospace industry and is capable of supporting a wide range of component, engine, and stage test activities.

“Ultimately, my goal is to continue to grow within my own abilities as an engineer and as a supervisor, and to help grow those that I have the opportunity to lead,” said Williams. “I want to align myself with the agency’s goals as a whole to continue to utilize our unique skillset to grow, build, evolve, and innovate.”

Williams began his career at the E-Complex in 1998 as an electrical technician contractor during the facility’s design and build phase. He quickly became familiar with the facility layout, the various systems under development, and the requirements involved in designing, building, and integrating those systems. He later advanced to the role of instrumentation and electrical engineer, gaining extensive institutional knowledge while developing expertise in the principles and importance of data validation.

In total, he brings 28 years of experience to NASA, along with an intimate understanding of the daily challenges his team of technicians faces.

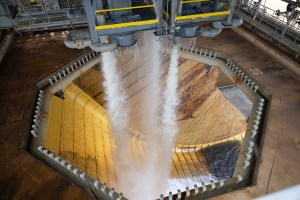
Williams’ primary work location is the E-1 test stand, which is able to handle extremely high pressures and massive flow rates of super cold cryogenics.

Unlike the A and B test complexes at NASA Stennis, where a fully built engine or stage can be installed, fueled, and fired, the E-Complex is highly adaptable.

When commercial partners need to validate large, complex components, they provide specific requirements. The team then customizes the test facility to replicate the exact extreme conditions the hardware is expected to encounter during operation. NASA collects and analyzes data from these precisely controlled test conditions to validate design predictions and determine whether design modifications are needed throughout the development process, from subscale testing through full-scale testing.

Whether validating valve timings, ensuring facility instrumentation is properly calibrated, supporting ultra-high pressure pumping and cryogenic transferring operations, or troubleshooting electrical and mechanical support systems, Williams and his team must execute each task with precision. By retaining Williams’ facility specific expertise in-house as a civil servant, NASA reduces long term operational risk.

Williams describes the opportunity to perform this mission critical work in public service as a dream come true, a dream that began decades ago during an elementary school field trip to NASA Stennis. Today, he finds himself working at NASA just as the agency returns to the Moon to stay through Artemis missions and builds a Moon Base, humanity’s first lunar outpost.

“Having the opportunity to play a role at NASA means a lot,” said Williams. “To this day, I am still a kid at heart looking out at the sky and the galaxy. Being a part of the mission and doing things I know we are capable of doing is an amazing, but also humbling, opportunity.”

Share

Details

Last Updated
Jul 29, 2026
Editor
Bo Black
Location
Stennis Space Center


from NASA https://ift.tt/8rWgaV2

Sizing Up the Sargassum Belt

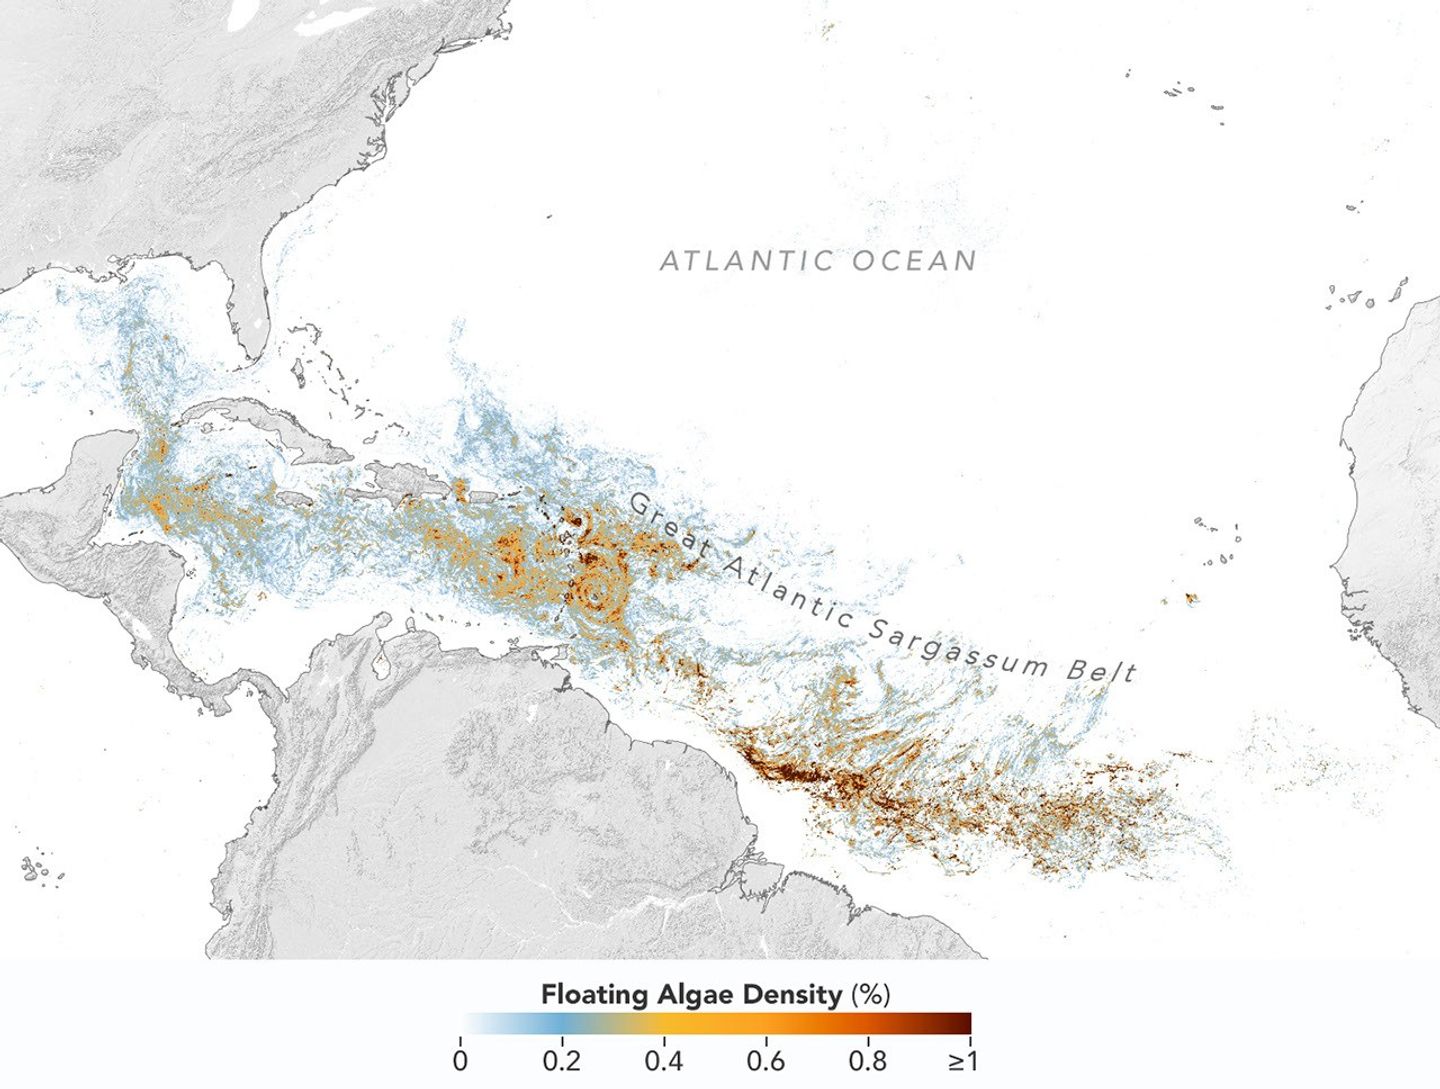
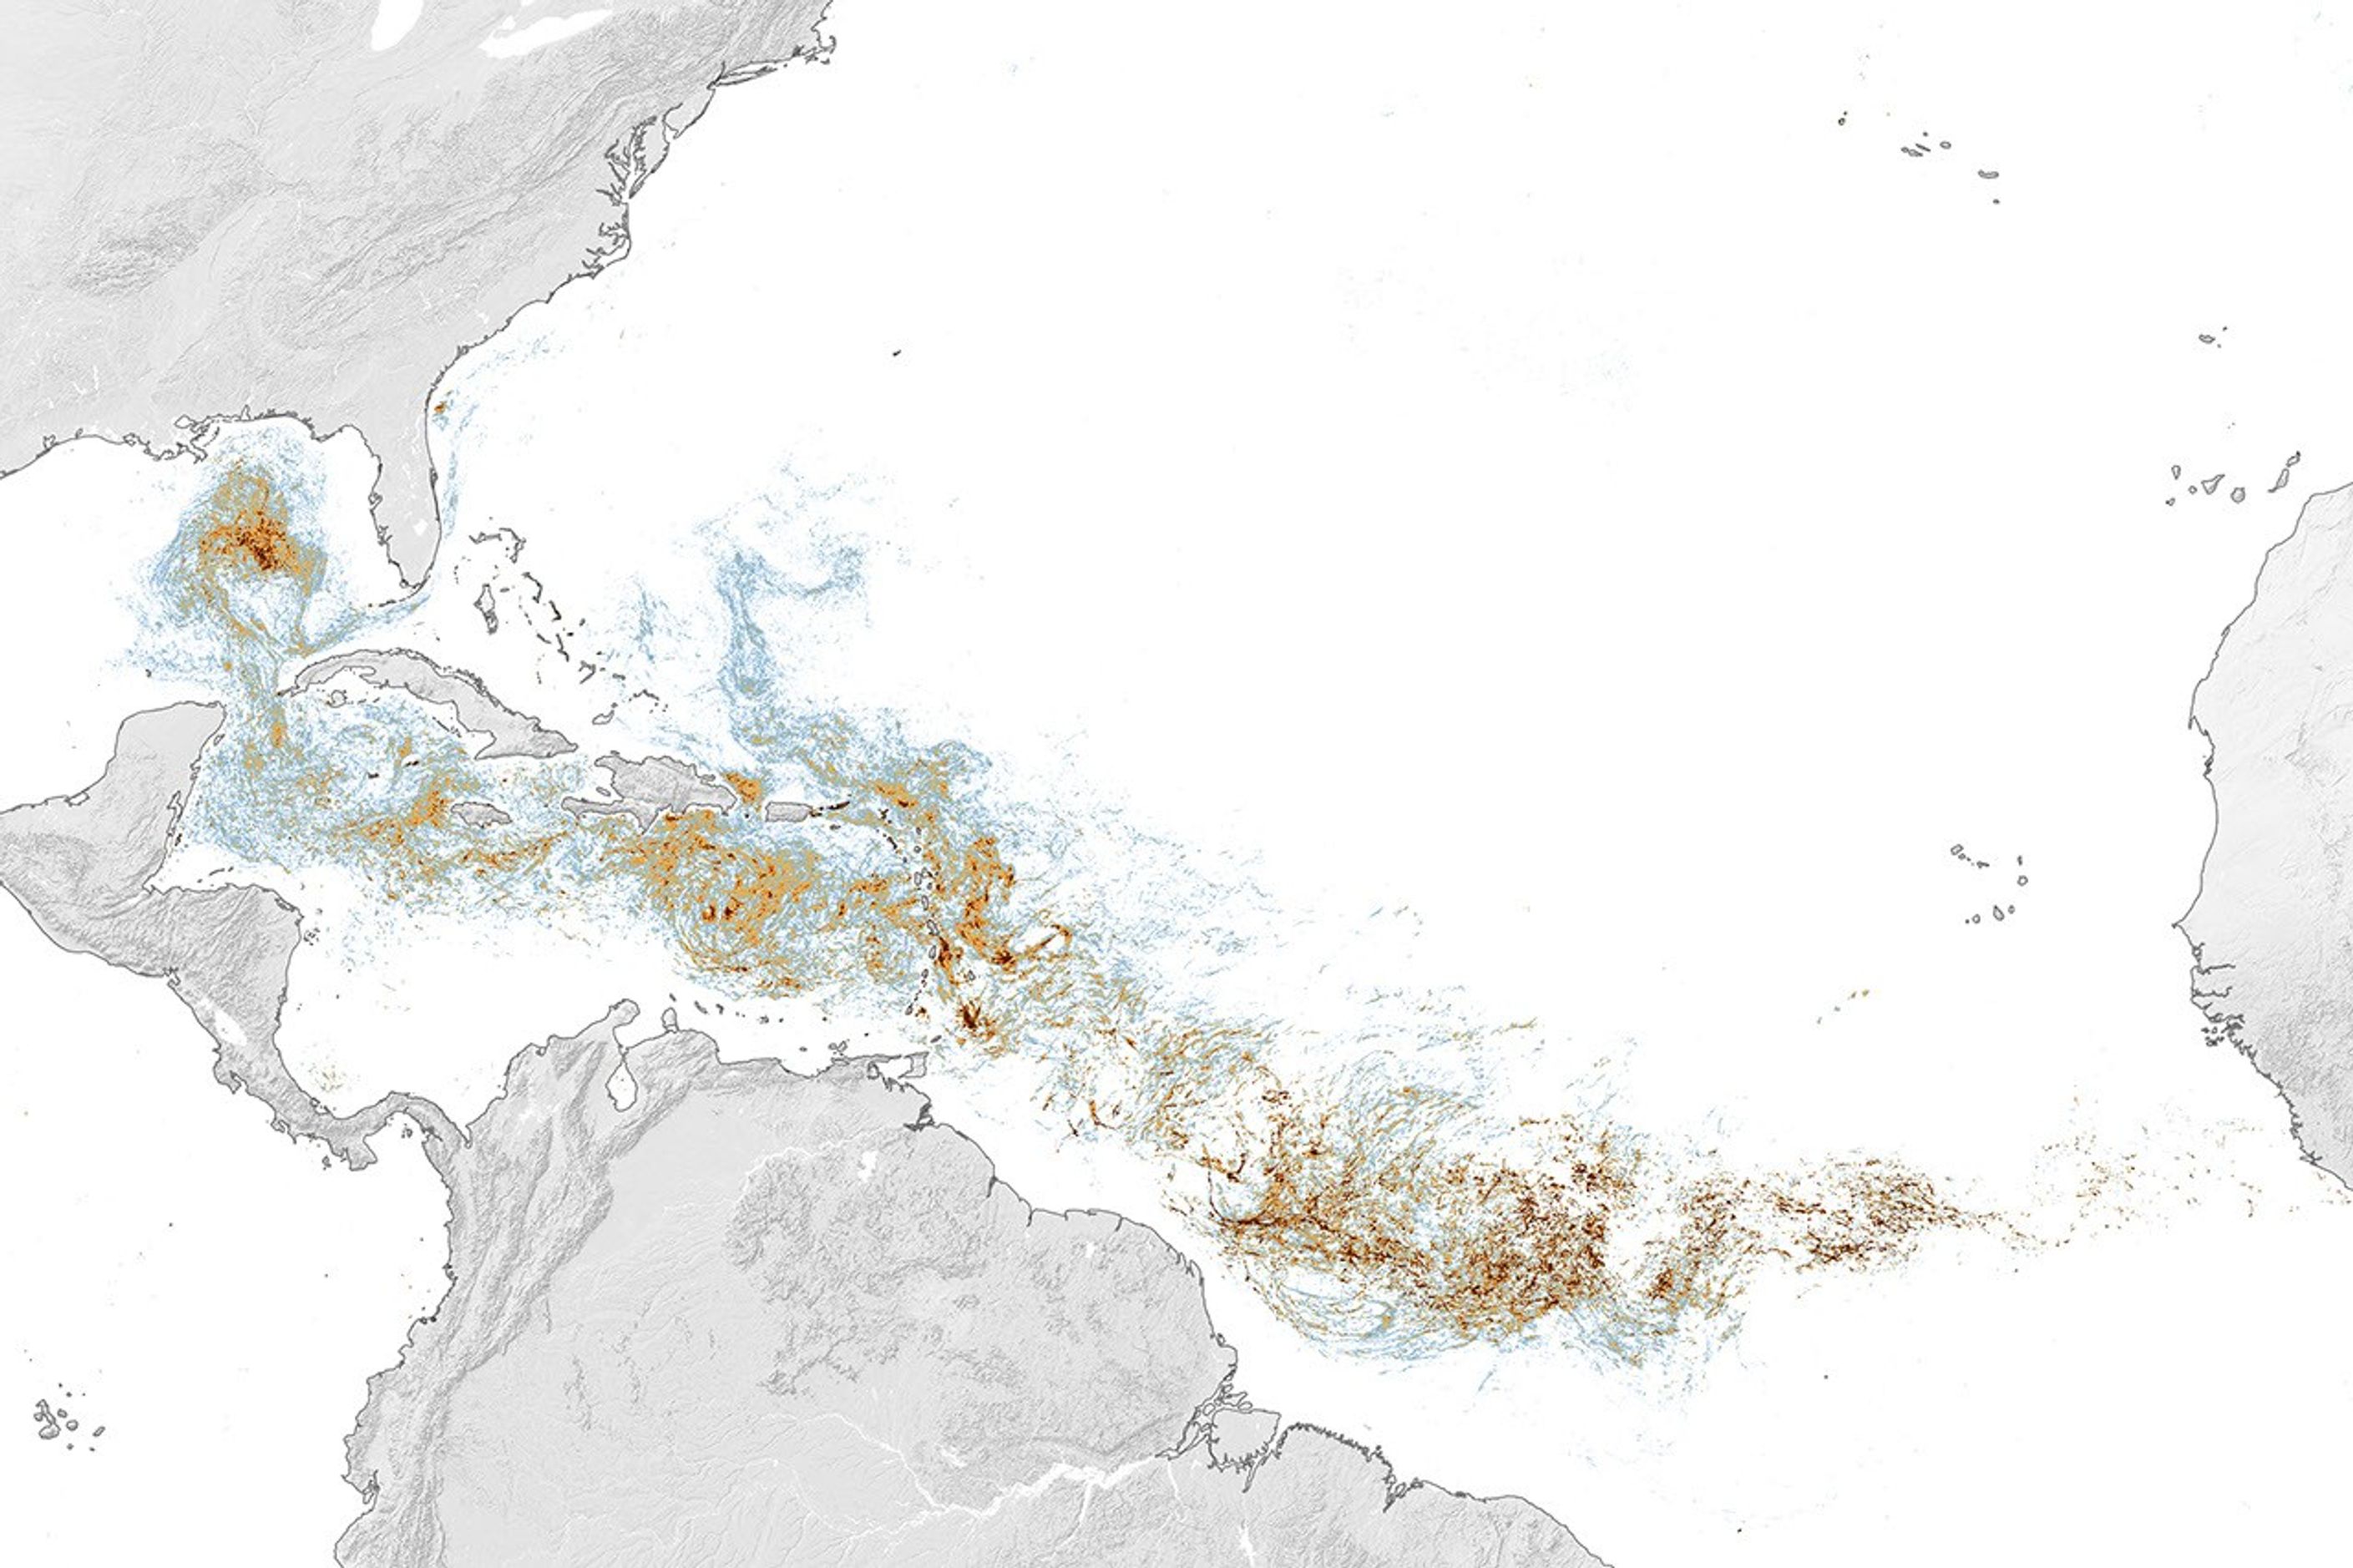
Map of the Atlantic Ocean showing Sargassum density from low (blue) to high (red) in June 2026, with the highest concentrations in the tropical Atlantic.
This map, based on data from the OCI (Ocean Color Instrument) on NASA’s PACE (Plankton, Aerosol, Cloud, ocean Ecosystem) satellite, shows Sargassum highly concentrated in the tropical Atlantic in June 2026.
NASA Earth Observatory/Lauren Dauphin

Sargassum, a type of brown floating algae, has shifted its range in recent decades, thinning out in the North Atlantic’s Sargasso Sea while proliferating in the tropical Atlantic. That trend, underway since 2011, continued in 2026 as the algae, commonly known as a type of seaweed, reached its annual peak in June across a stretch of ocean known as the Great Atlantic Sargassum Belt.

The belt’s Sargassum abundance in June 2026 made it the second-highest Sargassum year in the satellite record, slightly behind 2025, according to scientists at the University of South Florida (USF) College of Marine Science. Regionally, the Caribbean Sea and the Gulf of America (Gulf of Mexico) both hit record highs, according to USF’s June 2026 Sargassum outlook. The western and eastern Caribbean saw 3.6 and 9 million metric tons, respectively, while the Gulf saw 5 million metric tons—nearly double its previous record, also set in 2025. 

“The belt is a basin-scale phenomenon that can have devastating local-scale impacts throughout the Caribbean and Gulf, and satellite observations are the only method that captures both scales on a daily basis,” said Brian Barnes, a marine scientist at the Optical Oceanography Laboratory at USF. “The tracking done by our lab helps communities know the current extent of Sargassum and prepare for what’s to come.”

In moderate amounts in the open ocean, Sargassum provides habitat for turtles, invertebrates, fish, and birds, and adds oxygen to the water through photosynthesis. But too much of it near shore can tangle and suffocate marine life, and mats that sink can smother corals and seagrasses. On beaches, decomposing Sargassum releases hydrogen sulfide, a rotten-egg-smelling gas that’s a potential problem for both ecosystems and tourism.

The map above shows Sargassum density in the tropical Atlantic Ocean in June 2026. Red and orange areas are where Sargassum densities were the highest. Note that although the “belt” appears continuous, discrete Sargassum mats are scattered across the ocean surface. The map is based on satellite measurements of how much of the ocean surface was covered by the seaweed, averaged per pixel across all observations made in June by the OCI (Ocean Color Instrument) on NASA’s PACE (Plankton, Aerosol, Cloud, ocean Ecosystem) satellite.

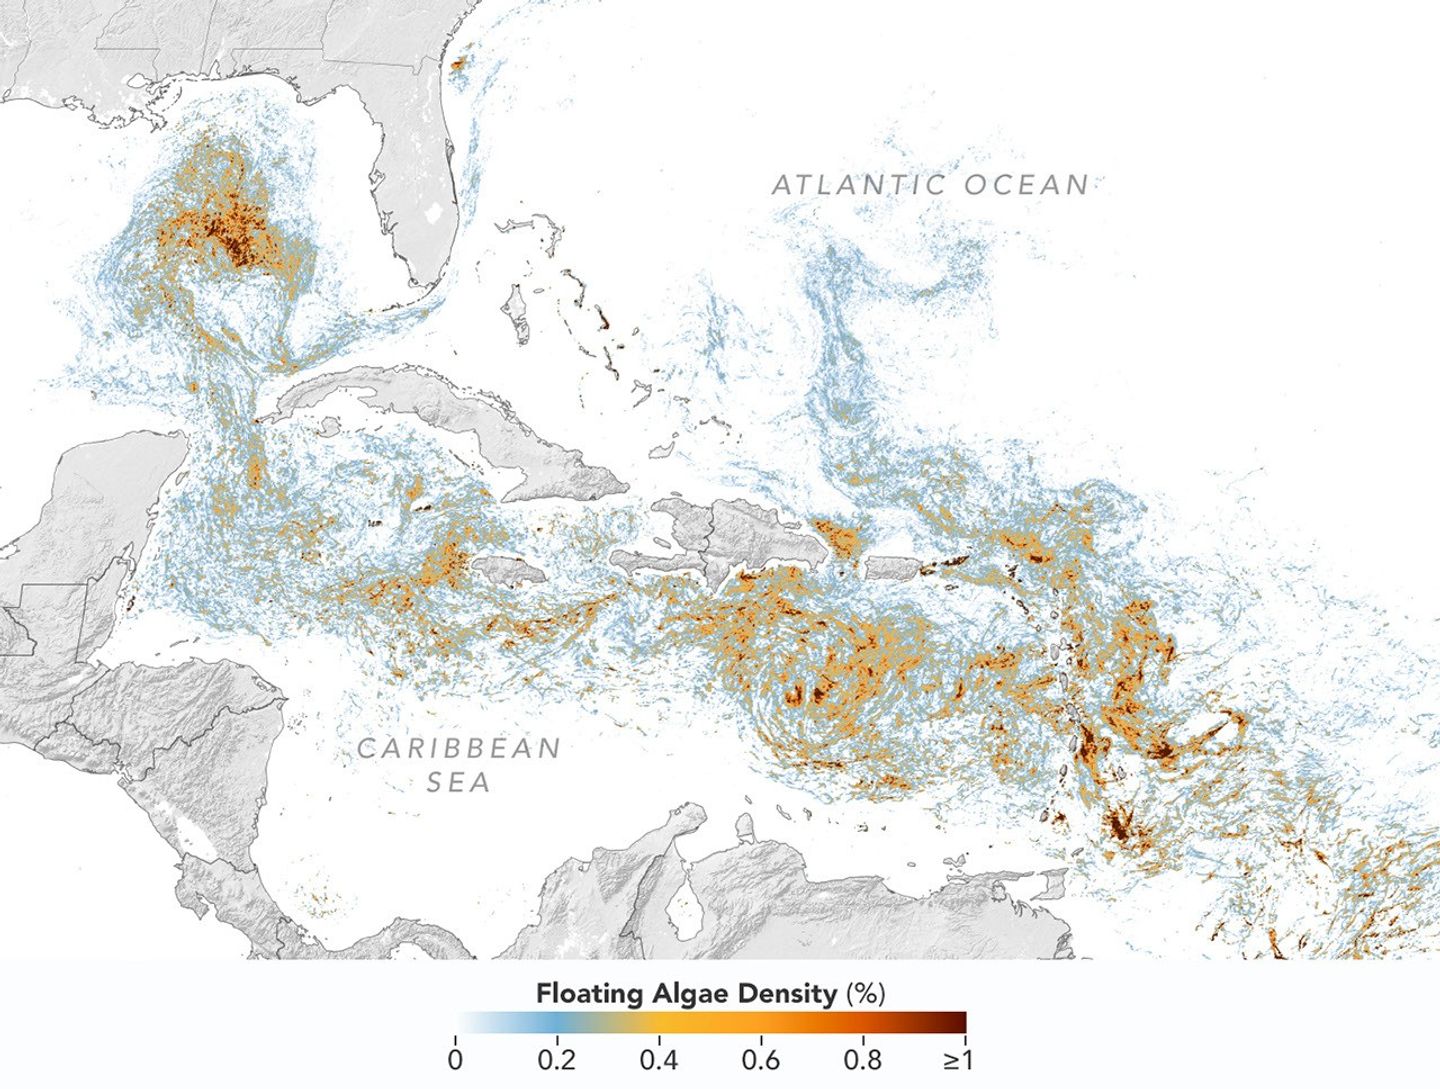
A detailed map of the Atlantic Ocean centered on the Caribbean Sea shows Sargassum density from low (blue) to high (red) in June 2026.
This detailed view of the same PACE OCI map highlights Sargassum concentrations across the Caribbean Sea and Gulf of America, both of which saw record-high amounts of the floating algae in June 2026.
NASA Earth Observatory/Lauren Dauphin

Ocean currents and winds shape the Sargassum belt, which, despite the patchiness, stretches nearly continuously from West Africa to the Gulf and holds a fairly steady “width” from the western tropical Atlantic westward, explained Chuanmin Hu, also an optical oceanographer at USF. The ocean currents have also spared Florida’s west coast from inundation this summer, while delivering large amounts of seaweed to the Florida Keys and the state’s east coast. The bulk of the Sargassum, however, is visible in the Caribbean Sea, shown in detail above, where problems associated with inundation have been more severe, Hu said.

Data for the maps were provided by Lin Qi, an oceanographer at NOAA’s Center for Satellite Applications and Research, who has been working to generate Sargassum maps based on data from PACE, which was launched in February 2024. The work extends that of Qi and colleagues at USF’s Optical Oceanography Laboratory. This team first developed Sargassum detection techniques using MODIS (Moderate Resolution Imaging Spectroradiometer) on NASA’s long-running Terra and Aqua satellites and VIIRS (Visible Infrared Imaging Radiometer Suite) on the NOAA-20 satellite—data that have been a key component of USF’s Sargassum Watch System and of research into the seaweed’s longer-term trends.

Satellites detect Sargassum by its signals in reflected sunlight. Because of its plant structure and chlorophyll pigments, Sargassum reflects more near-infrared light than water. Scientists flag pixels where the reflectance spikes above the levels produced by plain seawater, and then they use the strength of this spike to estimate Sargassum density, which refers to the fraction of ocean surface covered by the seaweed in each pixel. Density estimates can then be converted into biomass, or the total weight of Sargassum present within a pixel, which is how the longer-term trends in the chart below are tracked.

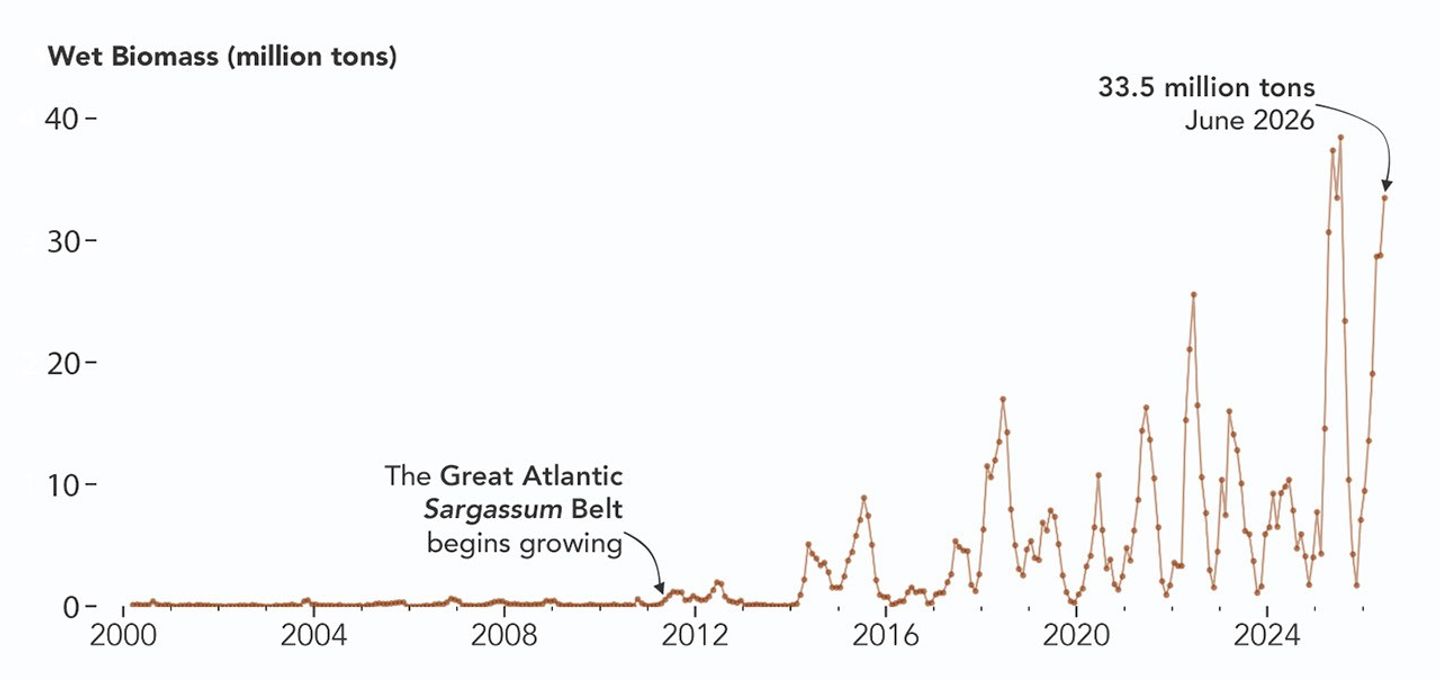
A chart of Sargassum biomass detected by MODIS since the early 2000s, showing amounts increasing beginning in 2011, with progressively higher spikes through summer 2025 and 2026.
NASA Earth Observatory/Lauren Dauphin

The chart above uses the continuous MODIS record since March 2000 to show how Sargassum biomass across the Great Atlantic Sargassum Belt has changed through June 2026. Notice the uptick beginning around 2011, when the belt was first developing, and the seasonal dips in winter and peaks in spring and summer. The record high in July 2025 stands out, followed by the quick rise in early 2026—especially in the first four months of the year—that culminated in the year’s peak in June. More recent observations, not yet reflected in the chart, indicate Sargassum biomass declined through the following month of July.

“Since the initial appearance of the Great Atlantic Sargassum Belt in 2011, the total Sargassum amount in the Atlantic Ocean has increased substantially, more than doubling every five years,” Hu said. He added that the exact mechanism is still being investigated, but it’s possibly related to ocean warming, multiple nutrient sources, and the fact that large Sargassum mats attract other organisms—such as nitrogen-fixing bacteria—that can supply additional nutrients to sustain further growth.

Alongside data from MODIS and VIIRS, OCI data from PACE now feeds into the Sargassum Watch System’s near-real-time daily and weekly composite maps. A recent study of the central-west Atlantic led by Qi, spanning May through August 2024, found that OCI offers several advantages over its predecessors, observing more of the ocean and detecting Sargassum with greater sensitivity.  

Hu noted that the added pixels from OCI can improve near-real-time monitoring and analyses of short-term fluctuations. And its higher sensitivity, he said, will also lead to improved maps during winter months, “thus helping understand Sargassum changes over time.”

Additionally, the study’s authors found that OCI’s hyperspectral capability makes it the only sensor able to spectrally discriminate Sargassum pixels across the Atlantic Ocean “without ambiguity,” adding confidence to the interpretation of detected image features—especially in parts of the Atlantic where another type of floating algae, Trichodesmium, has been reported.

“I think I can speak for all project members, past and present, in sharing how rewarding it is to see the promise of PACE’s advancements come to life,” said Jeremy Werdell, PACE project scientist at NASA’s Goddard Space Flight Center. “OCI has started a true renaissance in aquatic ecosystem monitoring from space.”

NASA Earth Observatory maps and chart by Lauren Dauphin, using PACE and MODIS data courtesy of Lin Qi (NOAA), and Brian Barnes and Chuanmin Hu (University of South Florida, Optical Oceanography Laboratory). Story by Kathryn Hansen.

Downloads

Map of the Atlantic Ocean showing Sargassum density from low (blue) to high (red) in June 2026, with the highest concentrations in the tropical Atlantic.

June 2026

JPEG (2.43 MB)

References & Resources

You may also be interested in:

Stay up-to-date with the latest content from NASA as we explore the universe and discover more about our home planet.

Color Off the Mid-Atlantic Coast

4 min read

Something is brewing in shallow waters offshore of Delaware, New Jersey, Maryland, and Virginia.

Article

A Turquoise Tint for the Black Sea

3 min read

Phytoplankton added a milky blue hue to the waters of the Black Sea and nearby waterways in spring and summer…

Article

El Niño Is Underway

4 min read

Satellite observations of sea surface height indicated that the 2026 event continued to strengthen in early June.

Article


from NASA https://ift.tt/CZK5f2U

NASA’s SpaceX CRS-35 Mission to Launch Health Research

NASA experiments focused on human and plant health and drug-resistant organisms will travel to the International Space Station aboard SpaceX...