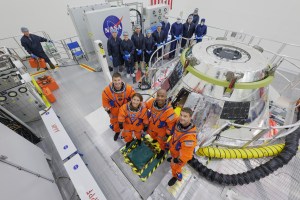
Teams at NASA’s Kennedy Space Center in Florida participate in the first joint integrated launch countdown simulation for Artemis I inside Firing Room 1 of the Launch Control Center on July 8, 2021. Seen at the top of the room is Charlie Blackwell-Thompson (right), launch director.
Credit: NASA/Ben Smegelsky
As four astronauts venture around the Moon on NASA’s Artemis II test flight in 2026, many people will support the journey from here on Earth. Teams directing operations from the ground include the mission management team, launch control team, flight control team, and the landing and recovery team, each with additional support personnel who are experts in every individual system and subsystem. The teams have managed every aspect of the test flight and ensure NASA is prepared to send humans beyond our atmosphere and into a new Golden Age of innovation and exploration.
Mission management team
Reviews of mission status and risk assessments are conducted by the mission management team, a group of 15 core members and additional advisors. Amit Kshatriya, NASA’s deputy associate administrator, Moon to Mars Program, will serve as the mission management team chair for the test flight.
Two days prior to launch, the mission management team will assemble to review mission risks and address any lingering preflight concerns. With more than 20 years of human spaceflight experience, Kshatriya will conduct polls at key decision points, providing direction for the relevant operations team. If circumstances during the flight go beyond established decision criteria or flight rules outlined ahead of the mission, the team will assess the situation based on the information available and decide how to respond.
Matt Ramsey, serving as the Artemis II mission manager, will oversee all elements of mission preparedness prior to the mission management team assembly two days before launch and serve as deputy mission management team chair throughout the mission. With more than two decades of experience at NASA, Ramsey managed the SLS (Space Launch System) Engineering Support Center for Artemis I.
Launch control team
The launch control team coordinates launch operations from NASA’s Kennedy Space Center in Florida. Charlie Blackwell-Thompson serves as the agency’s Artemis launch director, responsible for integrating and coordinating launch operations for the SLS, Orion, and Exploration Ground Systems Programs, including developing and implementing plans for countdown, troubleshooting, and timing.
Two days before liftoff, when the countdown for launch begins, Blackwell-Thompson’s team will begin preparations for launch from their console positions in Firing Room 1 in Kennedy’s Launch Control Center. On the day of launch, Blackwell-Thompson and her team will manage countdown progress, propellent loading, and launch commit criteria. The criteria include standards for systems involved in launch, and the team will monitor the rocket until it lifts off from the launchpad.
Rick Henfling, flight director, monitors systems in the Flight Control Center at NASA’s Johnson Space Center in Houston.
Credit: NASA
Flight control team
From solid rocket booster ignition until the crew is safely extracted from the Orion capsule following splashdown in the Pacific Ocean at the end of their mission, the flight control team oversees operations from the Mission Control Center at NASA’s Johnson Space Center in Houston. Multiple flight directors will take turns leading the team throughout the 10-day mission to support operations around the clock. Jeff Radigan, bringing more than 20 years of International Space Station experience to Artemis II, will serve as lead flight director for the mission. The work for this role begins well in advance of the mission with building mission timelines; developing flight rules and procedures; leading the flight control team through simulations that prepare them for the flight test; and then helping them carry out the plan.
On launch day, the ascent flight control team will be led by Judd Frieling, an Artemis I flight director who also supported more than 20 shuttle missions as a flight controller. Frieling is responsible for overseeing the crew’s ascent to space, including performance of SLS core stage engines, solid rocket boosters, and propulsion systems from the moment of launch until the separation of Orion from the Interim Cryogenic Propulsion Stage. As Orion is propelled toward the Moon, guidance of operations will pass to the next flight director.
At the opposite end of the mission, Rick Henfling will take the lead for Orion’s return to Earth and splashdown. Orion will reenter Earth’s atmosphere at roughly 25,000 mph to about 20 mph for a parachute-assisted splashdown. Drawing from a background supporting space shuttle ascent, entry, and abort operations and 10 years as a space station flight director, Henfling and the team will monitor weather forecasts for landing, watch over Orion’s systems through the dynamic entry phase, and to ensure the spacecraft is safely shutdown before handing over operations to the recovery team.
At any point during the mission, a single voice will speak to the crew in space on behalf of all members of the flight control team: the capsule communicator, or CapCom. The CapCom ensures the crew in space receives clear and concise communication from the teams supporting them on the ground. NASA astronaut Stan Love will serve as the lead CapCom for Artemis II. Love flew aboard STS-122 mission and has acted as CapCom for more than a dozen space station expeditions. He is also part of the astronaut office’s Rapid Prototyping Lab, which played a key role in development of Orion’s displays and controls.
Landing, recovery team
Retrieval of the crew and Orion crew module will be in the hands of the landing and recovery team, led by Lili Villarreal. The team will depart San Diego on a Department of Defense ship, and head to the vicinity of the landing site several days before splashdown for final preparations alongside the U.S. Navy and DOD.
The recovery team is made up of personnel operating from the ship, land, and air to recover both astronauts and the capsule. Decision-making authority during the recovery phase of mission operations belongs to Villarreal, who served as deputy flow director for Artemis I and worked in the operations division for the space station.
The success of Artemis II will pave the way for the next phase of the agency’s campaign, landing on the lunar South Pole region on Artemis III. These teams, along with the four crew members and countless NASA engineers, scientists, and personnel, are driving humanity’s exploration on the Moon, Mars, and beyond.
Preparations for Next Moonwalk Simulations Underway (and Underwater)
Robert Mosher, HIAD materials and processing lead at NASA Langley, holds up a piece of webbing material, known as Zylon, which comprise the straps of the HIAD.
NASA/Joe Atkinson
Components of a NASA technology that could one day help crew and cargo enter harsh planetary environments, like that of Mars, are taking an extended trip to space courtesy of the United States Space Force.
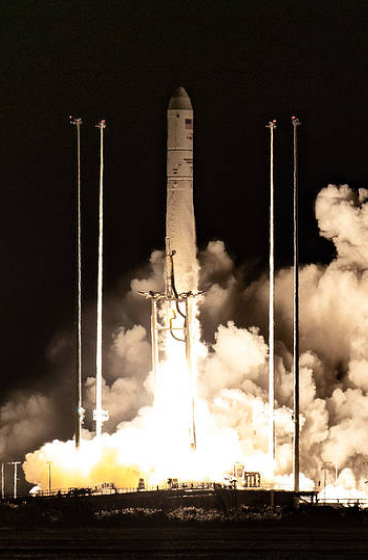
On Aug. 21, several pieces of webbing material, known as Zylon, which comprise the straps of the HIAD (Hypersonic Inflatable Aerodynamic Decelerator) aeroshell developed by NASA’s Langley Research Center in Hampton, Virginia, launched to low Earth orbit along with other experiments aboard the Space Force’s X-37B Orbital Test Vehicle. This trip will help researchers characterize how the Zylon webbing responds to long-duration exposure to the harsh vacuum of space.
The strap material on the HIAD aeroshell serves two purposes – short strap lengths hold together HIAD’s inflatable rings and longer pieces help to distribute the load more evenly across the cone-shaped structure. The HIAD aeroshell technology could allow larger spacecraft to safely descend through the atmospheres of celestial bodies like Mars, Venus, and even Saturn’s moon, Titan.
“We’re researching how HIAD technology could help get humans to Mars. We want to look at the effects of long-term exposure to space – as if the Zylon material is going for a potential six to nine-month mission to Mars,” said Robert Mosher, HIAD materials and processing lead at NASA Langley. “We want to make sure we know how to protect those structural materials in the long term.”
The Zylon straps are visible here during the inflation of LOFTID as part of a November 2022 orbital flight test. LOFTID was a version of the HIAD aeroshell — a technology that could allow larger spacecraft to safely descend through the atmospheres of celestial bodies like Mars, Venus, and even Saturn’s moon, Titan.
NASA
Flying Zylon material aboard the Space Force’s X-37B mission will help NASA researchers understand what kind of aging might occur to the webbing on a long space journey before it experiences the extreme environments of atmospheric entry, during which it has to retain strength at high temperatures.
Multiple samples are in small canisters on the X-37B. Mosher used two different techniques to put the strap material in the canisters. Some he tightly coiled up, others he stuffed in.
“Typically, we pack a HIAD aeroshell kind of like you pack a parachute, so they’re compressed,” he said. “We wanted to see if there was a difference between tightly coiled material and stuff-packed material like you would normally see on a HIAD.”
Some of the canisters also include tiny temperature and humidity sensors set to collect readings at regular intervals. When the Space Force returns the samples from the X-37B flight, Mosher will compare them to a set of samples that have remained in canisters here on Earth to look for signs of degradation.
The material launched to space aboard the Space Force’s X-37B Orbital Test Vehicle, seen here earlier this year.
Courtesy of the United States Space Force
“Getting this chance to have the Zylon material exposed to space for an extended period of time will begin to give us some data on the long-term packing of a HIAD,” Mosher said.
Uninflated HIAD aeroshells can be packed into small spaces within a spacecraft. This results in a decelerator that can be much larger than the diameter of its launch vehicle and can therefore land much heavier loads and deliver them to higher elevations on a planet or other celestial body.
Rigid aeroshells, the sizes of which are dictated by the diameters of their launch vehicles, typically 4.5 to 5 meters, are capable of landing well-equipped, car-sized rovers on Mars. By contrast, an inflatable HIAD, with an 18-20m diameter, could land the equivalent of a small, fully furnished ranch house with a car in the garage on Mars.
NASA’s HIAD aeroshell developments build on the success of the agency’s LOFTID (Low-Earth Orbit Flight Test of an Inflatable Decelerator) mission that launched on Nov. 10, 2022, resulting in valuable insights into how this technology performs under the stress of re-entering Earth’s atmosphere after being exposed to space for a short time period.
NASA astronaut Zena Cardman poses for a portrait in a photography studio on March 22, 2024, at NASA’s Johnson Space Center in Houston, Texas.
Cardman is currently aboard the International Space Station, where she perform research, technology demonstrations, and maintenance activities. Recently, she took a robotics test on a computer for the portion of the CIPHER study that measures space-caused changes to her brain structure and function; she also installed high-definition cameras on a spacesuit helmet.
Cardman launched to the space station on NASA’s SpaceX Crew-11 mission. Members of Crew-11 will contribute to NASA’s Artemis campaign by simulating Moon landing scenarios that future crews may encounter near the lunar South Pole.
Learn more about station activities by following the space station blog.
Inside NASA’s New Orion Mission Evaluation Room for Artemis II
As NASA’s Orion spacecraft is carrying crew around the Moon on the Artemis II mission, a team of expert engineers in the Mission Control Center at NASA’s Johnson Space Center in Houston will be meticulously monitoring the spacecraft along its journey. They’ll be operating from a new space in the mission control complex built to host the Orion Mission Evaluation Room (MER). Through the success of Orion and the Artemis missions, NASA will return humanity to the Moon and prepare to land an American on the surface of Mars.
Inside the Mission Evaluation Room, dozens of engineers will be monitoring the spacecraft and collecting data, while the flight control team located in mission control’s White Flight Control Room is simultaneously operating and sending commands to Orion during the flight. The flight control team will rely on the engineering expertise of the evaluation room to help with unexpected spacecraft behaviors that may arise during the mission and help analyze Orion’s performance data.
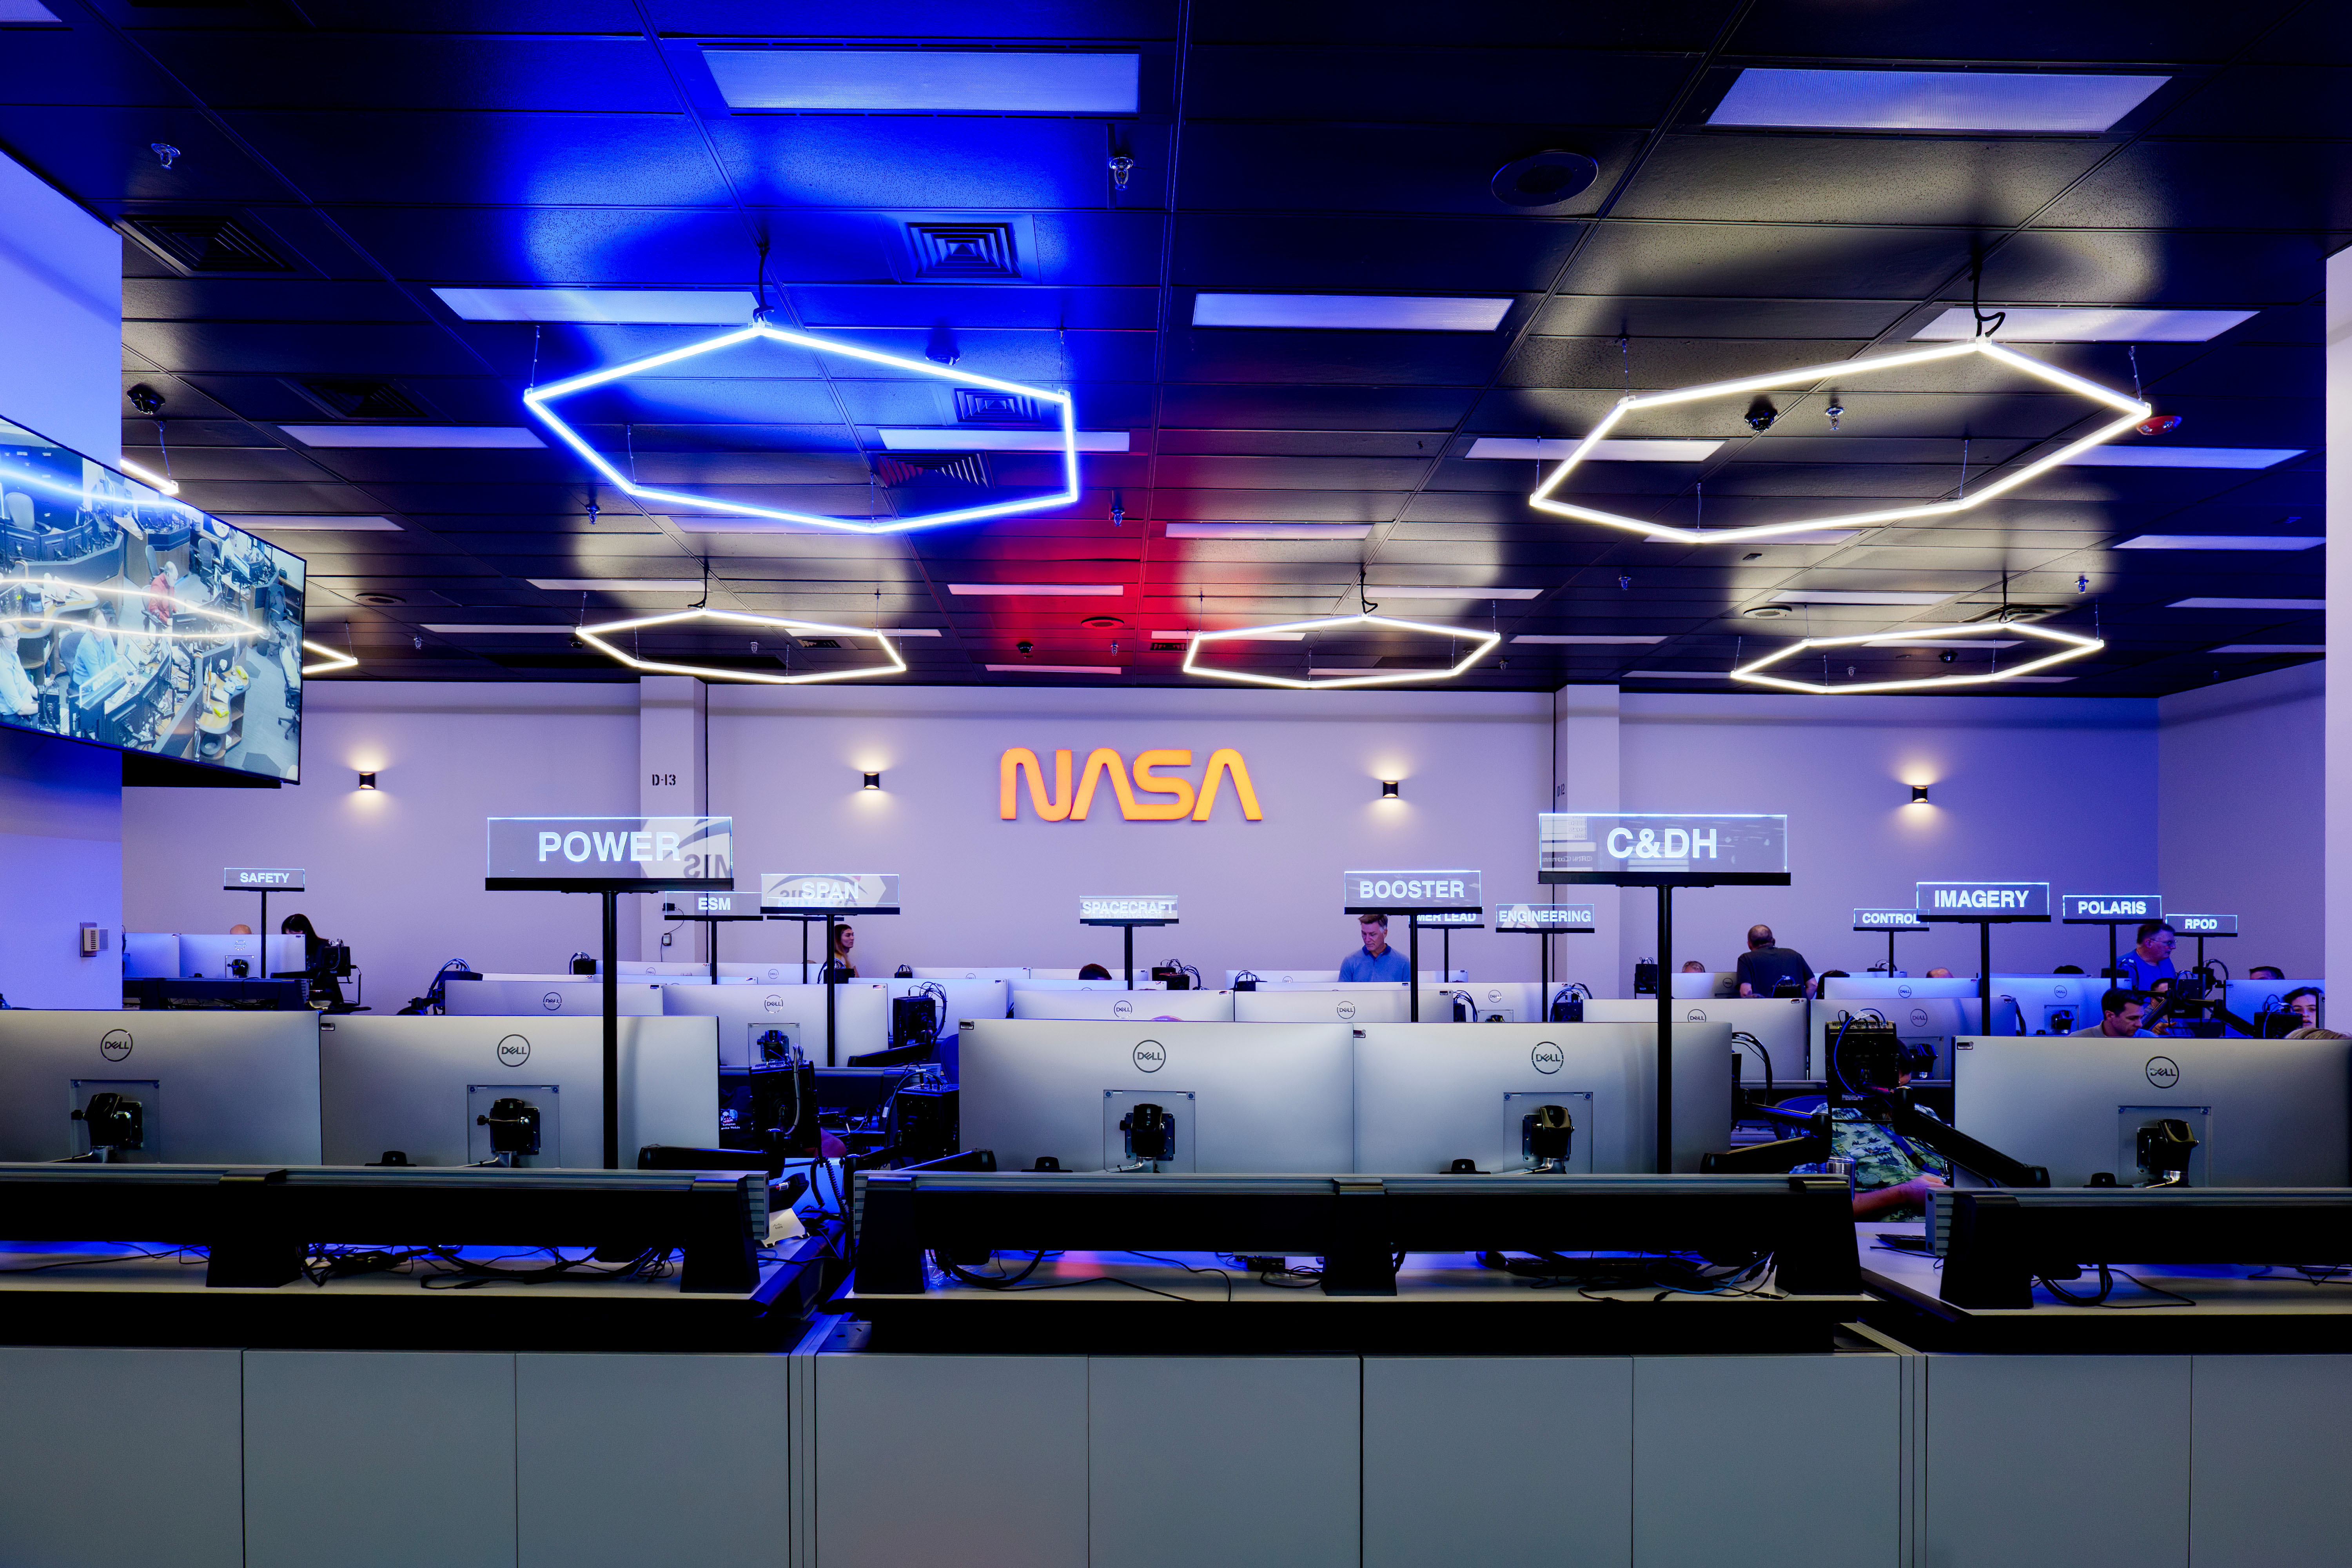
The new Orion Mission Evaluation Room inside the Mission Control Center at NASA’s Johnson Space Center in Houston.
NASA/Rad Sinyak
The Mission Evaluation Room team is made up of engineers from NASA, Lockheed Martin, ESA (European Space Agency), and Airbus who bring deep, expert knowledge of the spacecraft’s subsystems and functions to the mission. These functions are represented across 24 consoles, usually staffed by two engineers in their respective discipline, often hosting additional support personnel during planned dynamic phases of the mission or test objectives.
“The operations team is flying the spacecraft, but they are relying on the Mission Evaluation Room’s reachback engineering capability from the NASA, industry, and international Orion team that has designed, built, and tested this spacecraft.”
Trey PerrymAn
Lead for Orion Mission and Integration Systems at NASA Johnson
Perryman guides the Artemis II Orion mission evaluation room alongside Jen Madsen, deputy manager for Orion’s Avionics, Power, and Software.
With crew aboard, Orion will put more systems to the test, requiring more expertise to monitor new systems not previously flown. To support these needs, and safe, successful flights of Orion to the Moon, NASA officially opened the all-new facility in mission control to host the Orion Mission Evaluation Room on Aug. 15.
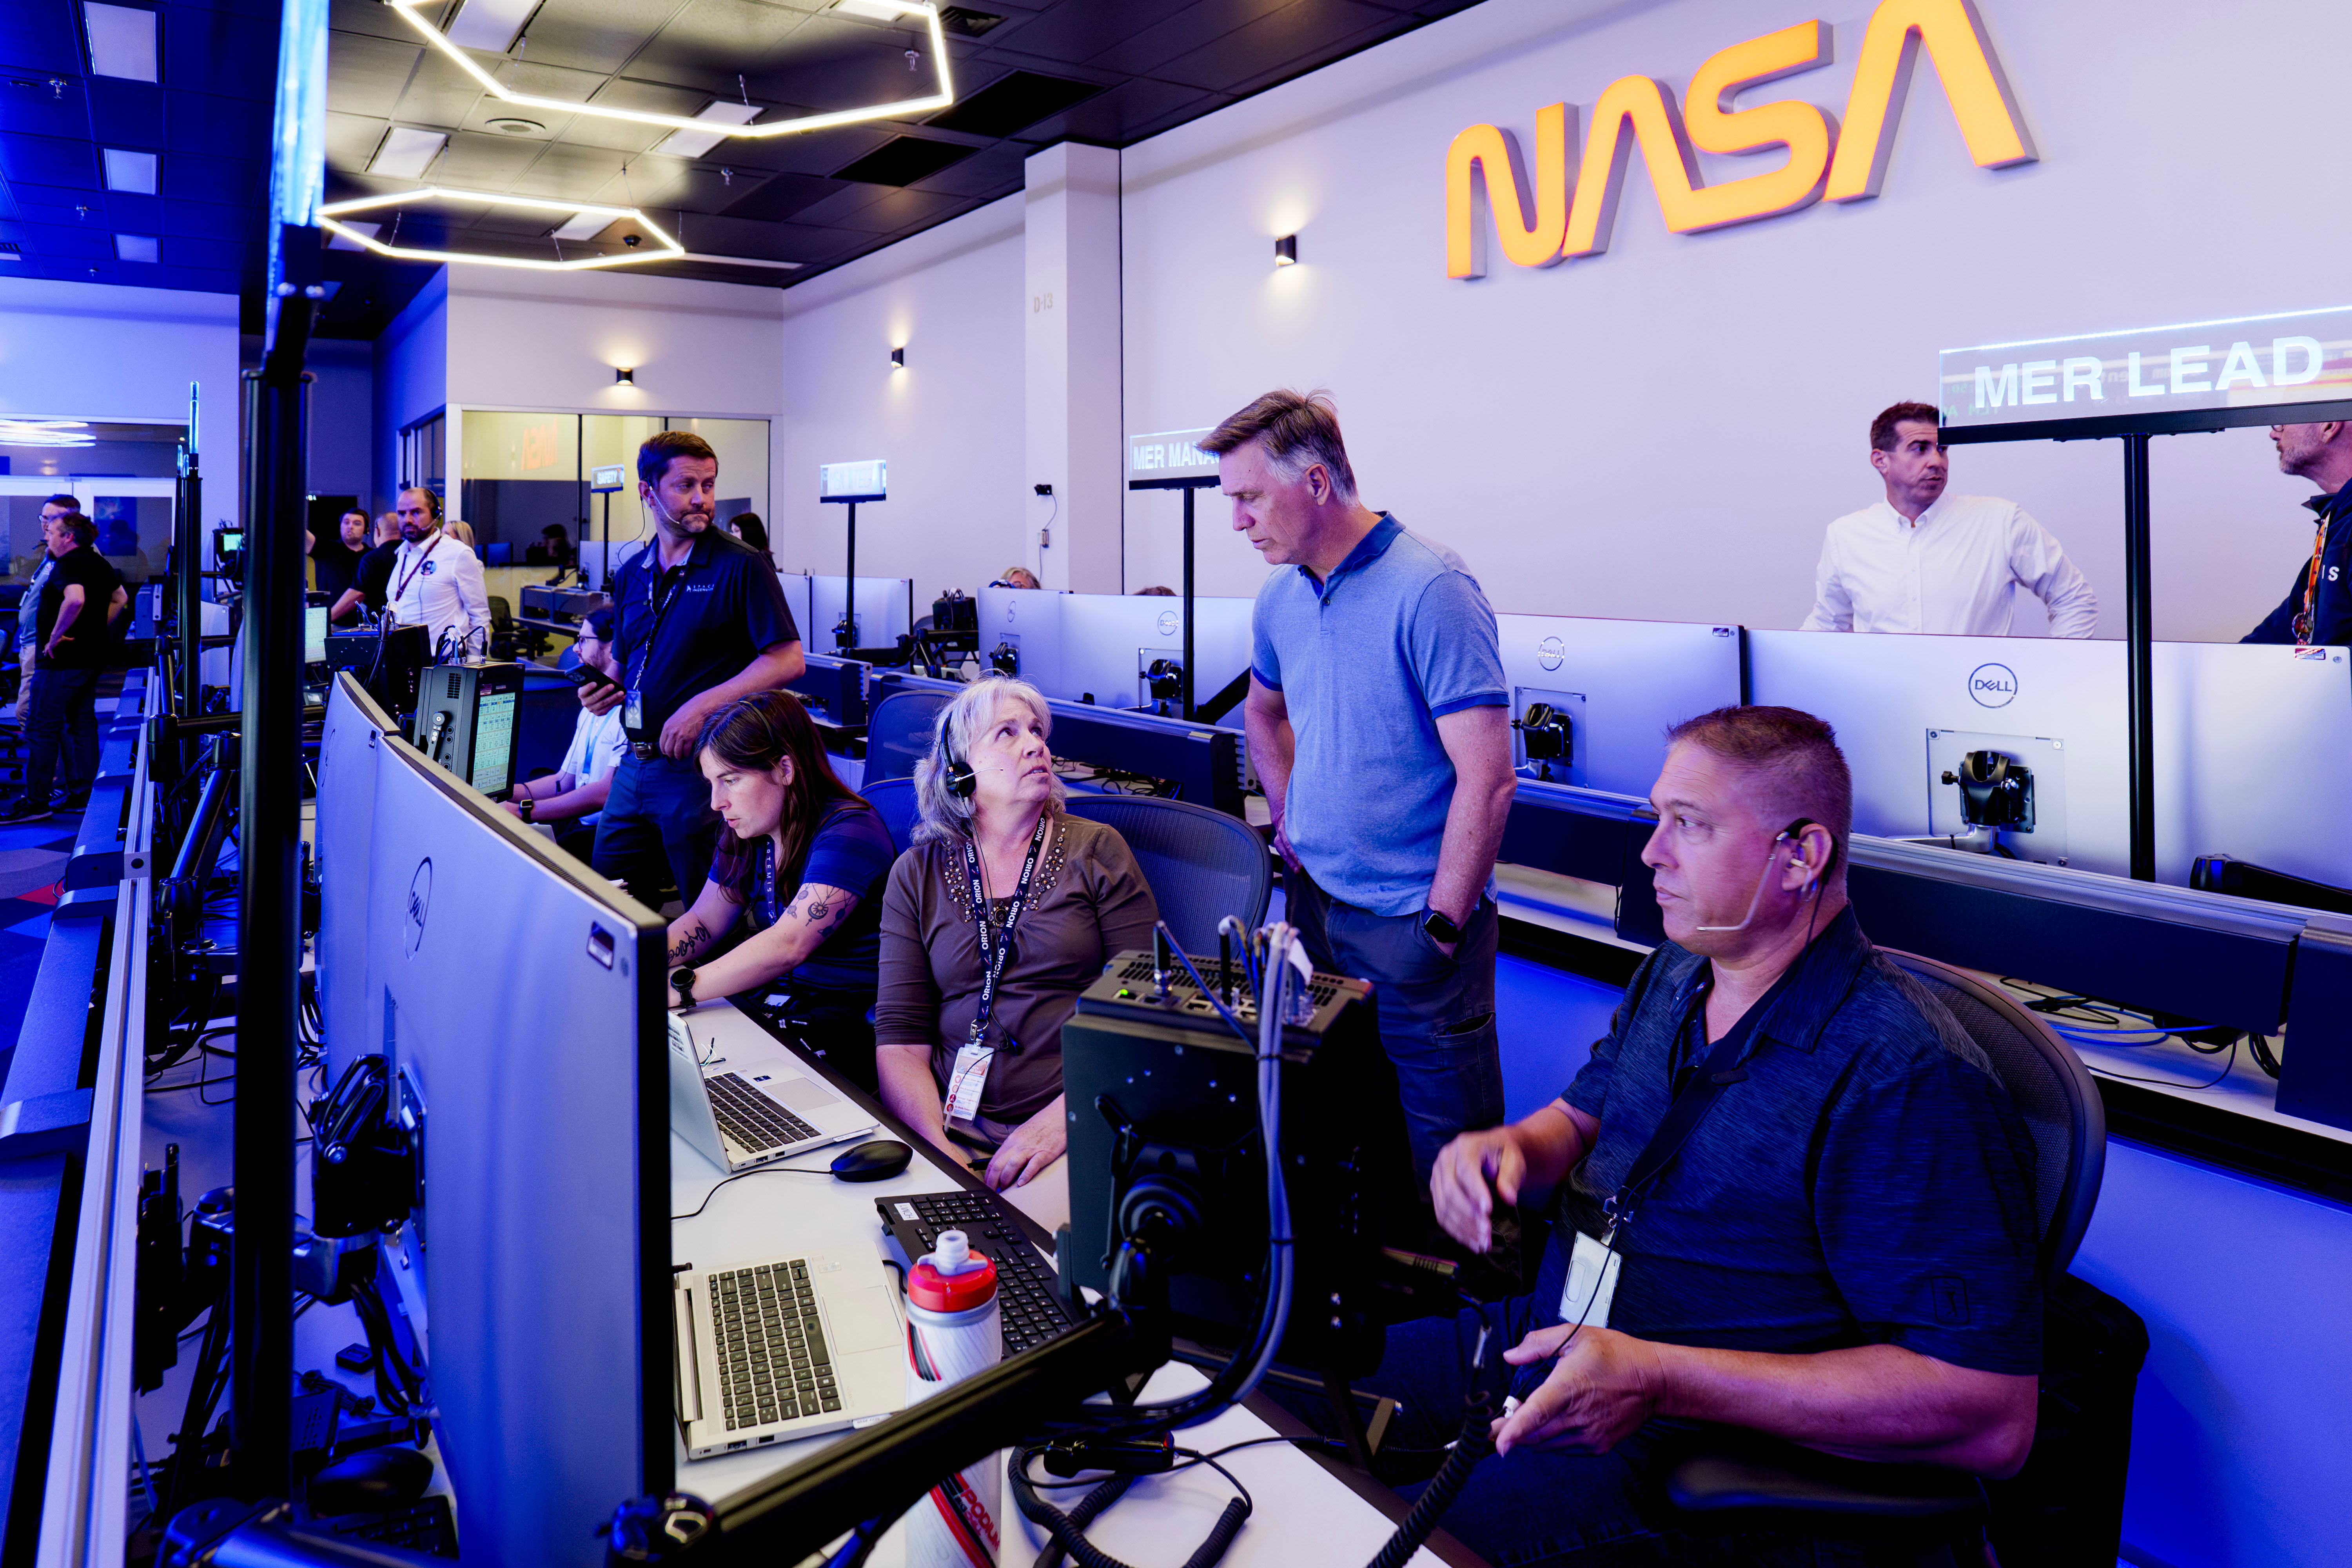
The Orion Mission Evaluation Room team works during an Artemis II mission simulation on Aug. 19, 2025, from the new space inside the Mission Control Center at NASA’s Johnson Space Center in Houston.
NASA/Rad Sinyak
During Artemis II, the evaluation room will operate in three daily shifts, beginning about 48 hours prior to liftoff. The room is staffed around the clock throughout the nearly 10 day mission, up until the spacecraft has been safely secured inside the U.S. Navy ship that will recover it after splashdown.
Another key function of the evaluation room is collecting and analyzing the large amount of data Orion will produce during the flight, which will help inform the room’s team on the spacecraft’s performance.
“Data collection is hugely significant,” Perryman said. “We’ll do an analysis and assessment of all the data we’ve collected, and compare it against what we were expecting from the spacecraft. While a lot of that data comparison will take place during the mission, we’ll also do deeper analysis after the mission is over to see what we learned.”
The Orion Mission Evaluation Room team works during an Artemis II mission simulation on Aug. 19, 2025, from the new space inside the Mission Control Center at NASA’s Johnson Space Center in Houston.
NASA/Rad Sinyak
If unplanned situations arise during the mission, the Mission Evaluation Room has additional layers of ability to support any specific need that presents itself. This includes various engineering support from different NASA centers, Lockheed Martin’s Integrated Test Lab, ESA’s European Space Research and Technology Center, and more.
“It’s been amazing to have helped design and build Orion from the beginning – and now, we’ll be able to see the culmination of all those years of work in this new Mission Evaluation Room."
Jen Madsen
Deputy Manager for Orion’s Avionics, Power, and Software
“We’ll see our spacecraft carrying our crew to the Moon on these screens and still be continuously learning about all of its capabilities,” said Madsen.
The Artemis II test flight will send NASA astronauts Reid Wiseman, Victor Glover, and Christina Koch, and CSA (Canadian Space Agency) astronaut Jeremy Hansen around the Moon and return them safely back home. This first crewed flight under NASA’s Artemis campaign will set the stage for NASA to return Americans to the lunar surface and help the agency and its commercial and international partners prepare for future human missions to Mars.
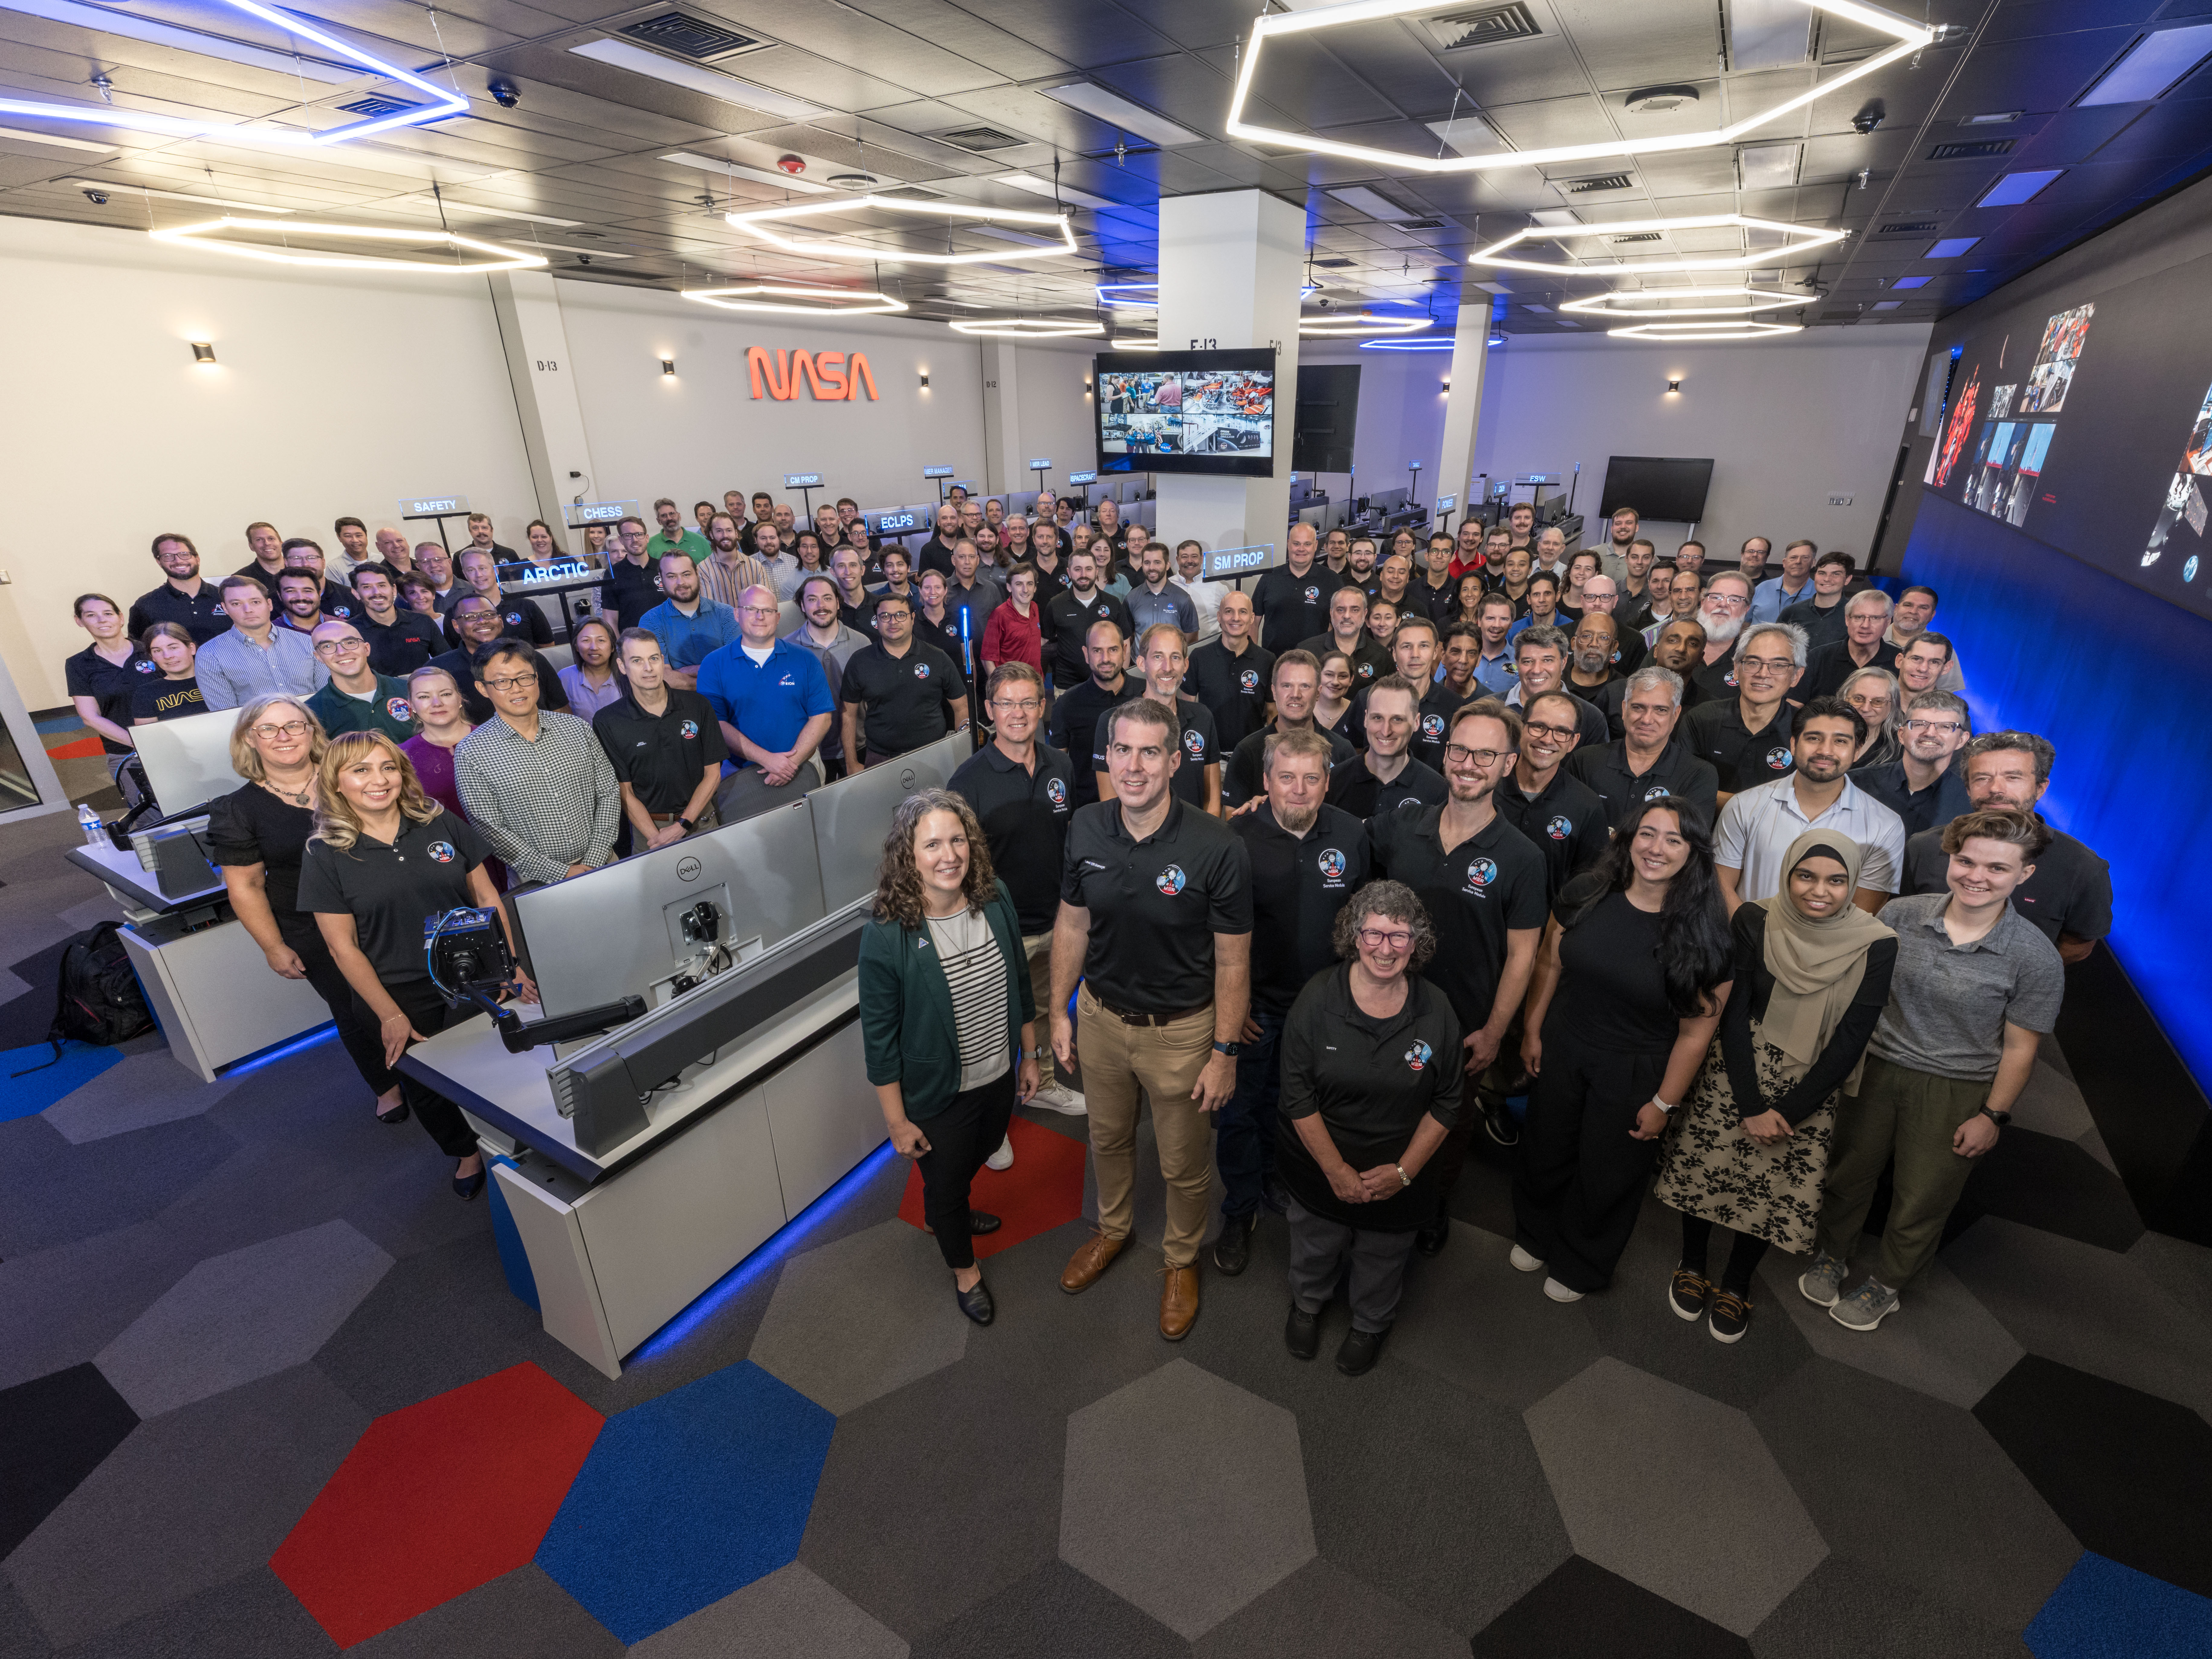
The Orion Mission Evaluation Room Team gathers for a group photo on Aug. 18, 2025.
Near the center of this image from NASA’s Chandra X-ray Observatory lies the pulsar B1509-58, a rapidly spinning neutron star that is only about 12 miles in diameter. This tiny object is responsible for producing an intricate nebula that resembles a human hand with a palm and extended fingers pointing to the upper right.
X-ray: NASA/CXC/Univ. of Hong Kong/S. Zhang et al.; Radio: ATNF/CSIRO/ATCA; H-alpha: UK STFC/Royal Observatory Edinburgh; Image Processing: NASA/CXC/SAO/N. Wolk
This image released on Aug. 20, 2025, combines new radio data from the Australia Telescope Compact Array with X-ray data from NASA’s Chandra X-ray Observatory. Chandra first released an image of this pulsar and its surrounding hand-shaped nebula in 2009. The new data provides a fresh view of this exploded star and its environment, which could help scientists understand its peculiar properties and shape.
Image credit: X-ray: NASA/CXC/Univ. of Hong Kong/S. Zhang et al.; Radio: ATNF/CSIRO/ATCA; H-alpha: UK STFC/Royal Observatory Edinburgh; Image Processing: NASA/CXC/SAO/N. Wolk
Credit: NASA’s Goddard Space Flight Center; Music Credit: “History in Motion” by Fred Dubois [SACEM], Koka Media [SACEM], Universal Publishing Production Music France [SACEM], and Universal Production Music.
On Aug. 7 and 8, NASA’s Nancy Grace Roman Space Telescope team assessed the observatory’s solar panels and a visor-like sunshade called the deployable aperture cover — two components that will be stowed for launch and unfold in space. Engineers confirmed their successful operation during a closely monitored sequence in simulated space-like conditions. On the first day, Roman’s four outer solar panels were deployed one at a time, each unfolding over 30 seconds with 30-second pauses between them. The visor followed in a separate test the next day. These assessments help ensure Roman will perform as expected in space. Roman is slated to launch no later than May 2027, with the team working toward a potential early launch as soon as fall 2026.
Curiosity Blog, Sols 4638-4640: Imaging Extravaganza Atop a Ridge
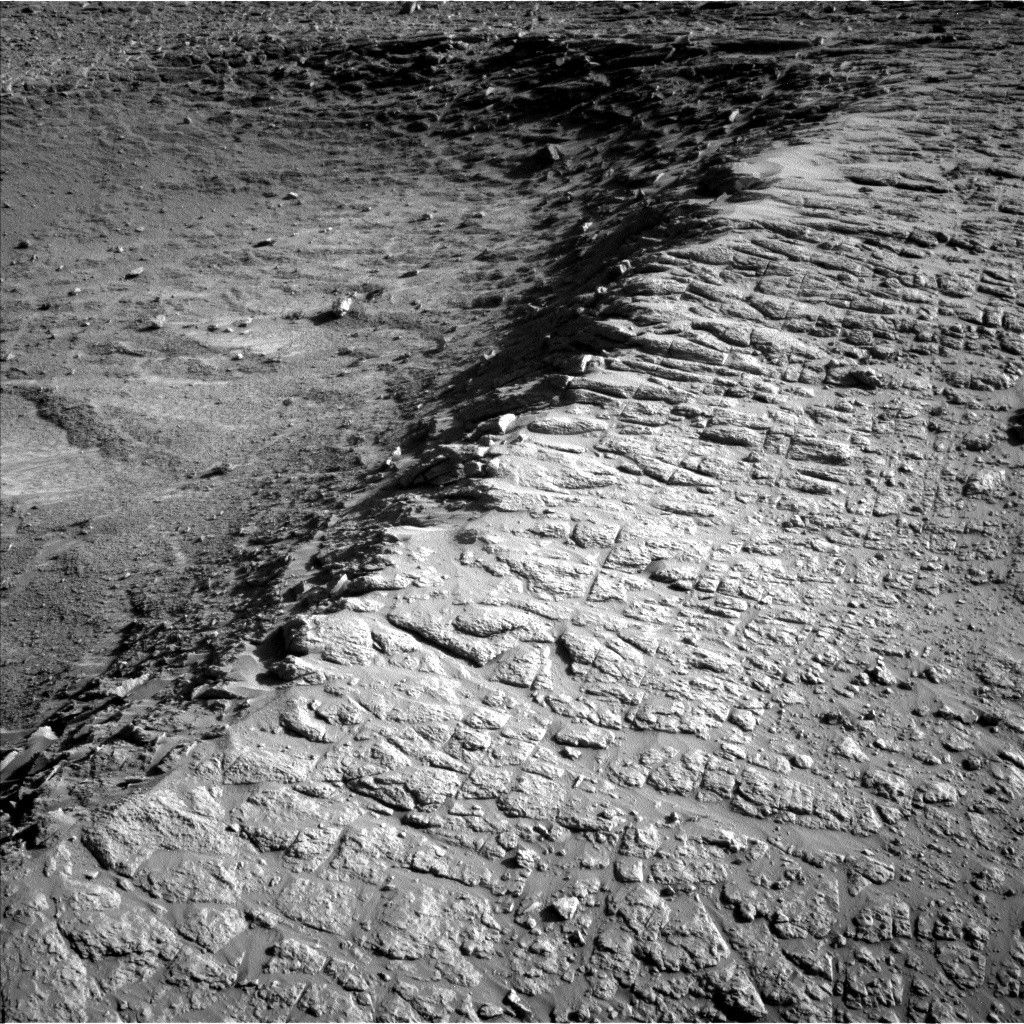
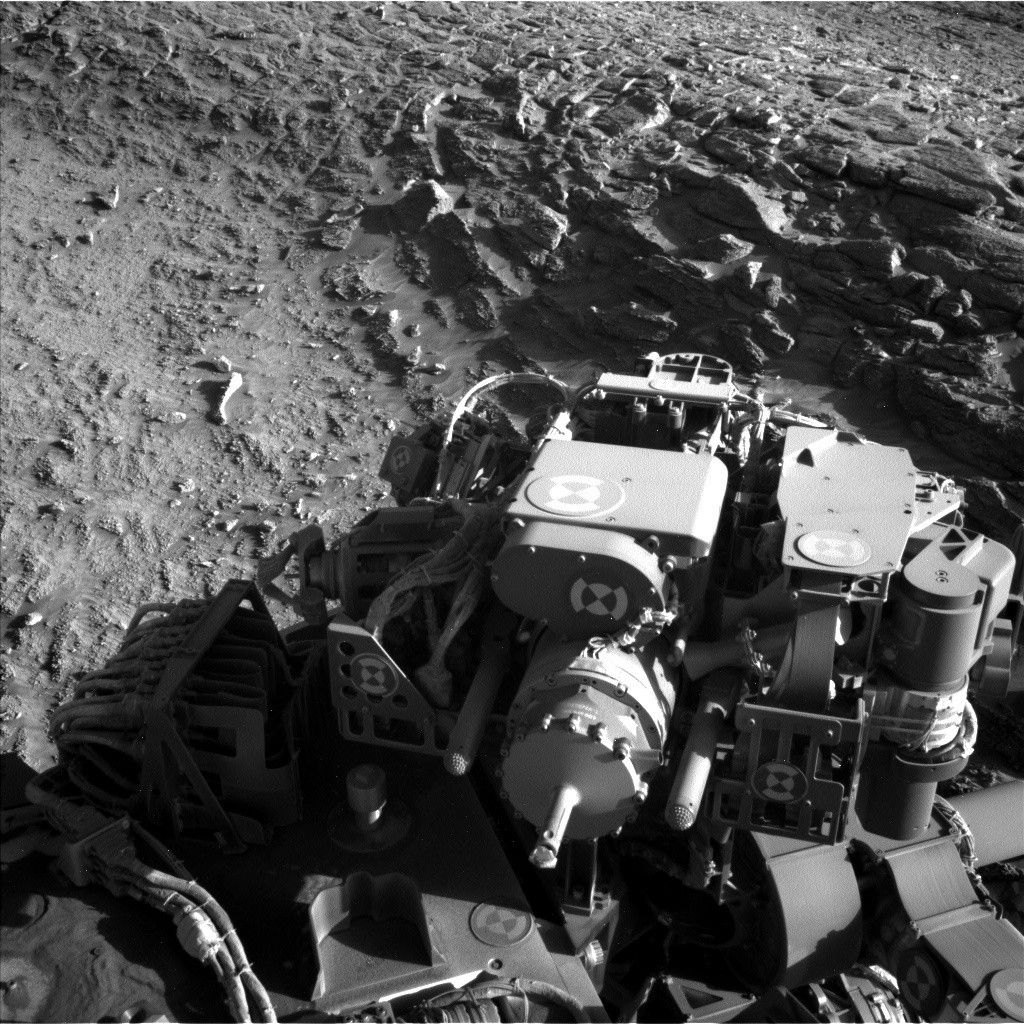
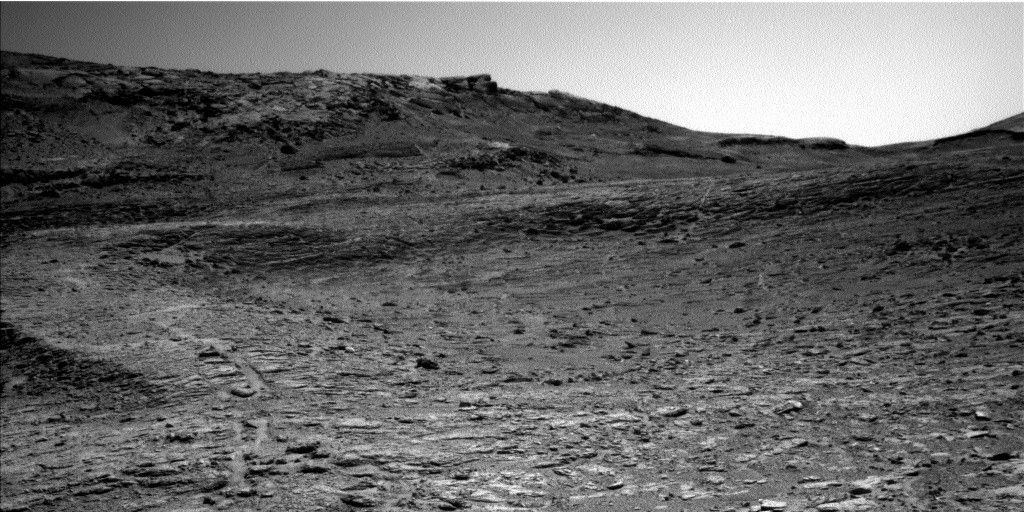
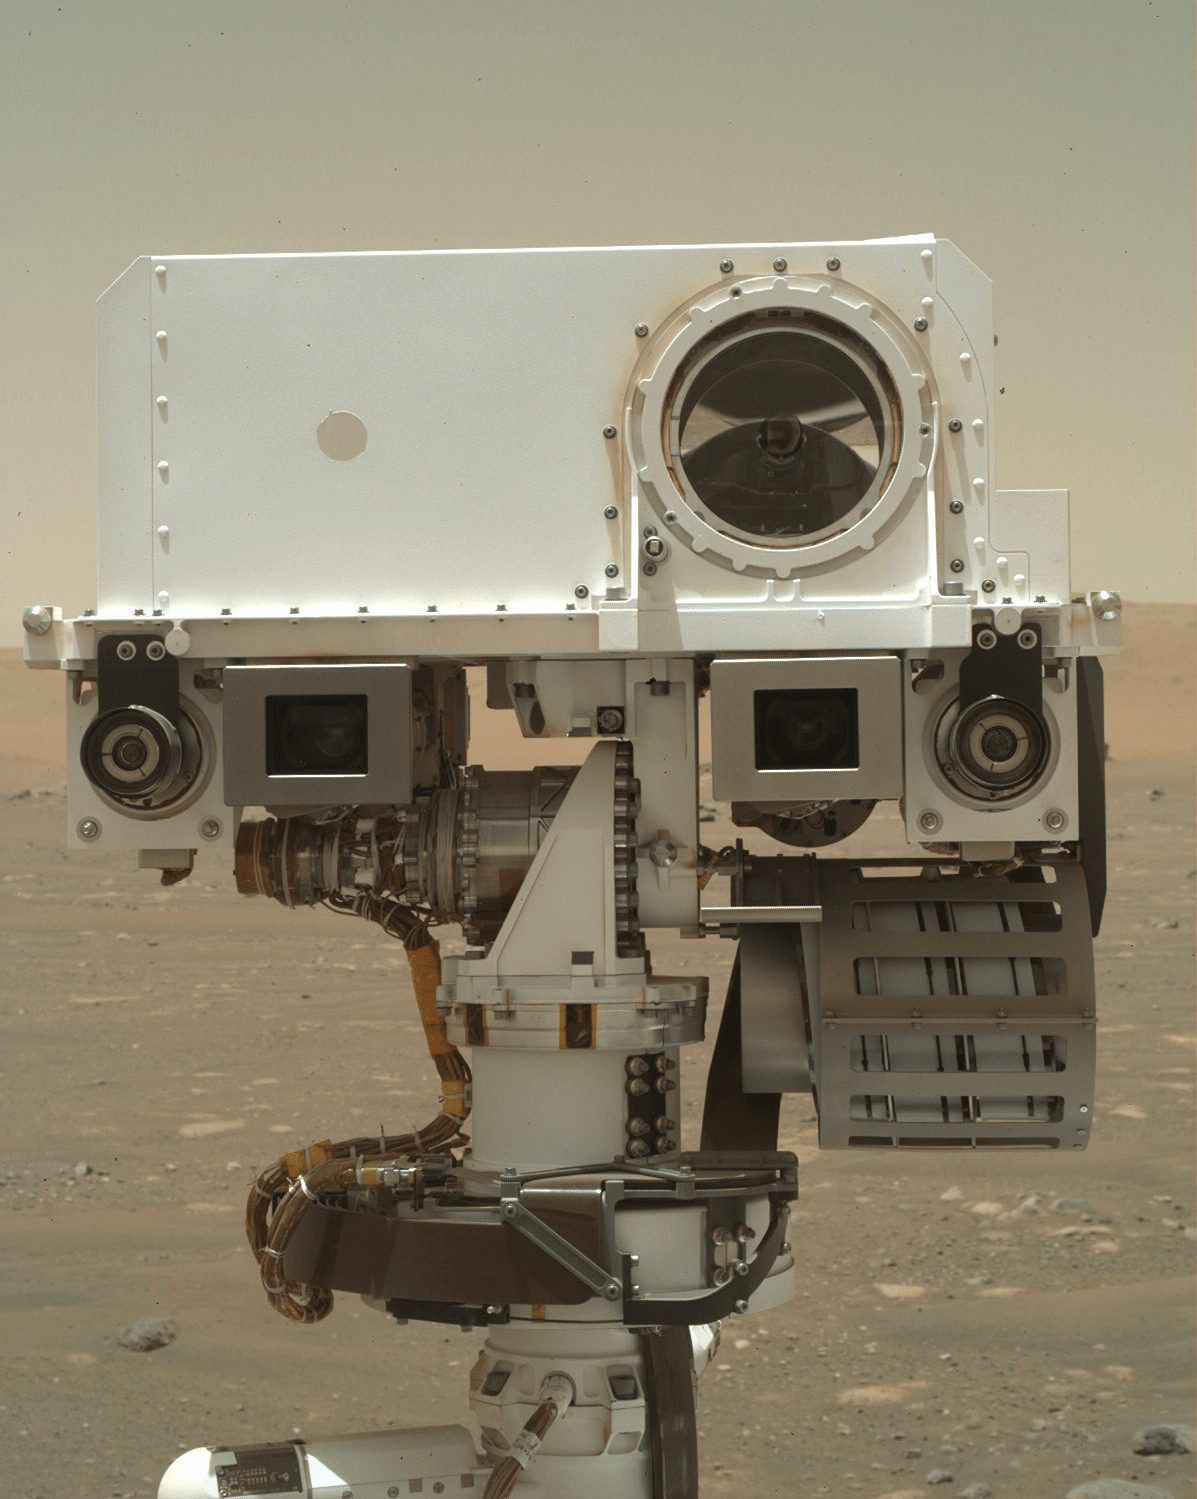
NASA’s Mars rover Curiosity acquired this image on Aug. 21, 2025, looking across the ridge that the rover is currently parked near the edge of, looking down into the “Thumb” region that mission planners hope to be exploring next week. Curiosity captured this image using its Left Navigation Camera on Sol 4636, or Martian day 4,636 of the MArs Science Laboratory mission, at 16:09:13 UTC.
NASA/JPL-Caltech
Written by Conor Hayes, Graduate Student at York University
Earth planning date: Friday, Aug. 22, 2025
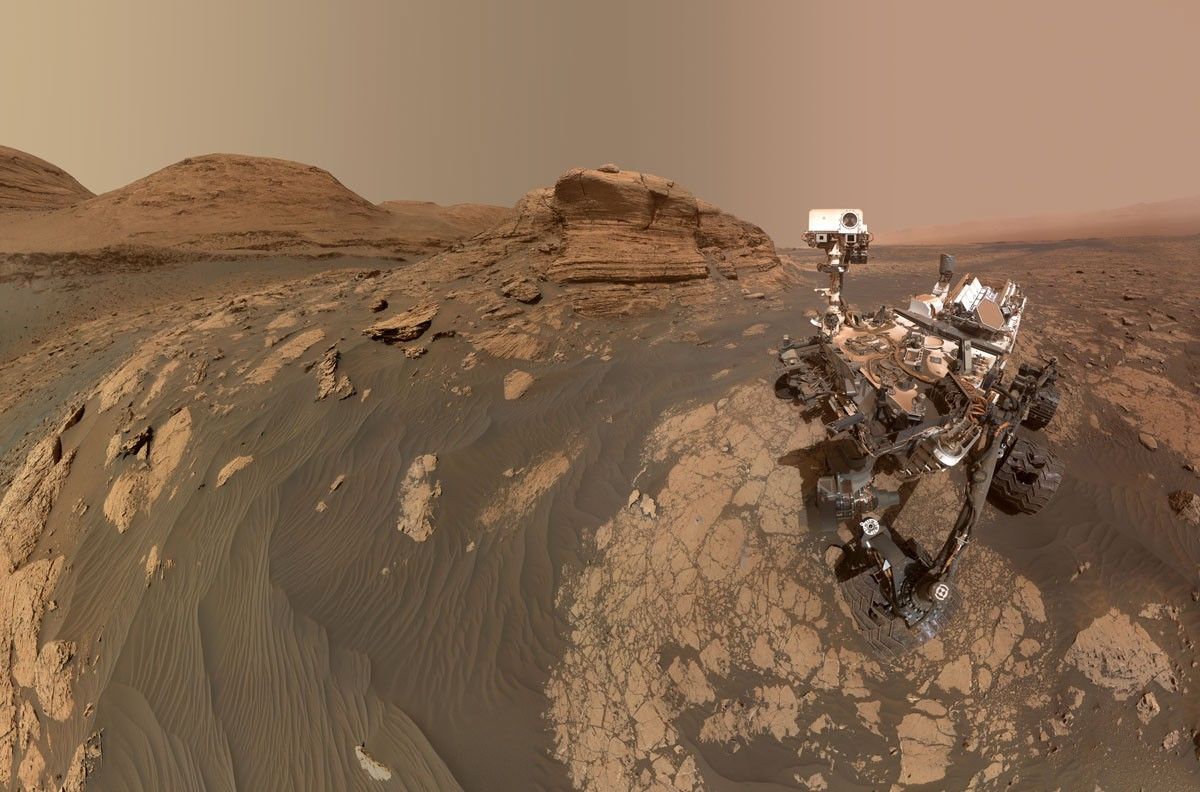
Curiosity is continuing its winding path through the mysterious boxwork structures that have been a major focus of the last several months of the mission. After driving away from “Río Frío,” we are now parked on top of a ridge overlooking a topographic depression that we’ve nicknamed the “Thumb.” The image on this post shows that ridge running along the “thumb’s” edge. Our goal today is to characterize this ridge before we drive down into the Thumb.
Because we had a lot of power and three sols available to play around with, this weekend plan is packed with a lot of good science. The boxwork structures in our immediate vicinity get a lot of attention, with Mastcam images planned of the targets “Wallatiri,” “Wallatiri 2,” “Mojo,” “Samaipata,” “Fort Samaipata,” and “Río Lluta,” as well as a nearby trough. ChemCam will be taking LIBS measurements of both Samaipata and Fort Saaipata as well. Samaipata gets even more attention from MAHLI, in addition to the targets “Vitichi” and “Tartagalita,” both of which will also be observed by APXS.
The boxwork structures don’t get all of the fun today, though. In addition to all of the boxwork observations, Mastcam will be documenting the ChemCam AEGIS target from Monday’s plan, and will also be doing some more imaging of the “Mishe Mokwa” butte. The highlight of Mastcam’s work in this plan (at least in my opinion) is the large 44-image mosaic of the north crater rim, taking advantage of the particularly low dust content of the atmosphere at this time of year. ChemCam will be taking several RMI images of Mishe Mokwa and a distant outcrop at “Dragones” that we will be driving towards over the next several months, as well as the usual post-drive AEGIS.
Rounding out this plan is a collection of observations of the atmosphere. In addition to typical DAN, REMS, and RAD activities, Curiosity’s Navcams will be put to work with a dust-devil movie, dust-devil survey, five cloud movies, and two line-of-sight observations of the north crater rim. Mastcam also gets involved in the environmental fun with a tau to track the amount of dust in the air.
Even with all of these activities, we decided that we aren’t yet done with this area. The drive in today’s plan is a short bump of about 2 meters (about 6.6 feet), so we’re all looking forward to continuing our investigation of this ridge on Monday.
Harmonized Landsat and Sentinel-2: Collaboration Drives Innovation
Introduction
Landsat, a joint program of NASA and the U.S. Geological Survey (USGS), has been an invaluable tool for monitoring changes in Earth’s land surface for over 50 years. Researchers use instruments on Landsat satellites to monitor decades-long trends, including urbanization and agricultural expansion, as well as short-term dynamics, including water use and disaster recovery. However, scientists and land managers often encounter one critical limitation of this program: Landsat has a revisit time of eight days (with Landsat 8 and 9 operating), which is too long to capture events and disasters that occur on short timescales. Floods, for example, can quickly inundate a region, and cloud cover from storms can delay Landsat’s ability to get a clear observation on damage.
In 2015, the European Space Agency’s (ESA) Copernicus Sentinel-2A mission joined Landsat 7 and 8 in orbit. It was designed to collect comparable optical land data with the intention of leveraging Landsat’s archive. Two years later, ESA launched Sentinel-2B, a satellite identical to Sentinel-2A.
Led by a science team at NASA’s Goddard Space Flight Center (GSFC), the USGS, NASA, and ESA began to work on combining the capabilities of Sentinel-2 and Landsat satellites. This idea was the impetus behind Harmonized Landsat and Sentinel-2 (HLS) project, a NASA initiative that created a seamless product from the Operational Land Imager (OLI) and Multi-Spectral Instrument (MSI) aboard Landsat and Sentinel-2 satellites, respectively. HLS Version 2.0 (V2.0) is the most recent version of these data and had a global median repeat frequency of 1.6 days in 2022 by combining observations from Landsat 8 and 9 and Sentinel-2A and B. The recent addition of Sentinel-2C data will provide even more frequent observations. With near-global coverage and improved harmonization algorithms, HLS V2.0 paves the way for new applications and improved land monitoring systems – see Animation 1. HLS data are available for download on NASA Earthdata: HLSL30v2.0 and HLSS30v2.0. These data can also be accessed through Google Earth Engine: HLSL30v2.0and HLSS30v2.0.
Animation 1. This visualization shows the change in vegetation in Maryland from January 1 to December 30, 2016, using Normalized Difference Vegetation Index (NDVI) data from Harmonized Landsat Sentinel-2 (HLS). The visualization shows land on both sides of the Chesapeake Bay, where red represents bare soil and green indicates healthy, growing vegetation.
Animation credit: Michael Taylor [Science Systems and Applications Inc. (SSAI)], Matthew Radcliff [USRA], and Jeffrey Masek [GSFC]. Caption adapted from Laura Rocchio [SSAI]
The Dawn of HLS
The story of HLS begins before the launch of Sentinel-2A in 2015. Jeffrey Masek [GSFC], who was at that time project scientist for Landsat 8, led a group of researchers who wanted to find a way to harmonize Landsat data with other satellite data. Their aim was to create a “virtual constellation” similar to how weather satellites operate.
“HLS meets a need that people have been asking for for a long time,” said Masek.
What began as a research question with an experimental product evolved into an operational project with the involvement of the Satellite Needs Working Group (SNWG). SNWG is an interagency effort to develop solutions that address Earth observation needs of civilian federal agencies. Every two years, SNWG conducts a survey of federal agencies to see how their work could benefit from satellite data. The answers span the gamut of application areas, from water quality monitoring to disaster recovery to planning how best to protect and use natural resources. SNWG brings these ideas to NASA, USGS, and the National Oceanic and Atmospheric Administration (NOAA) – the three main U.S. government providers of satellite data. These agencies work together to create and implement solutions that serve those needs. NASA plays a critical role in every step of the SNWG process, including leading the assessment of survey responses from over 30 federal agencies, managing and supporting the implementation of identified solutions, and encouraging solution co-design with federal partners to maximize impact.
The HLS surface reflectance product was an outcome of the very first SNWG solution cycle in 2016. This product was expanded, following additional SNWG requests in 2020 and 2022. The 2020 cycle saw the creation of nine HLS-derived vegetation indices, and the 2022 cycle aimed for a six-hour latency product.
In the July 2025 issue of Remote Sensing of Environment, a team of researchers outlined the HLS V2.0 surface reflectance dataset and algorithms. The team included seven NASA co-authors, members of the 2018–2023 Landsat Science Team, and ESA. The lead author, Junchang Ju [GSFC—Remote Sensing Scientist], has been the technical lead on HLS since its inception. Co-author Christopher Neigh [GSFC—Landsat 8/9 Project Scientist] is the principal investigator on the HLS project. V2.0, which was completed in Summer 2023, incorporates several major improvements over HLS V1.4, the most recent publicly available HLS product. HLS V1.4 covered about 30% of the global land area, providing data on North America and other select locations. HLS V2.0 provides data at a spatial resolution of 30 m (98 ft) with near-global coverage from 2013 onward. The dataset includes all land masses except Antarctica. HLS V2.0 also has key algorithmic improvements in atmospheric correction, cloud masking, and bidirectional reflectance distribution function (BRDF) correction. Together, these algorithms “harmonize” the data, or ensure that the distinct Landsat and Sentinel-2 datasets can effectively be used interchangeably – see Animation 2.
Animation 2: The visualization provides the Normalized Difference Vegetation Index (NDVI) data from Harmonized Landsat Sentinel-2 (HLS) for farm fields south of Columbus, NE. The red represents bare soil and green represents healthy, growing vegetation. The animation runs from January 1 to December 30, 2016.
Animation credit: Michael Taylor [SSAI], Matthew Radcliff [USRA], and Jeffrey Masek [GSFC]. Caption adapted from Laura Rocchio [SSAI]
HLS V2.0 in Action
The increased frequency of observations improved the ability of the scientific community to track disaster recovery, changes in phenology, agricultural intensification, rapid urban growth, logging, and deforestation. Researchers are already putting these advances to use.
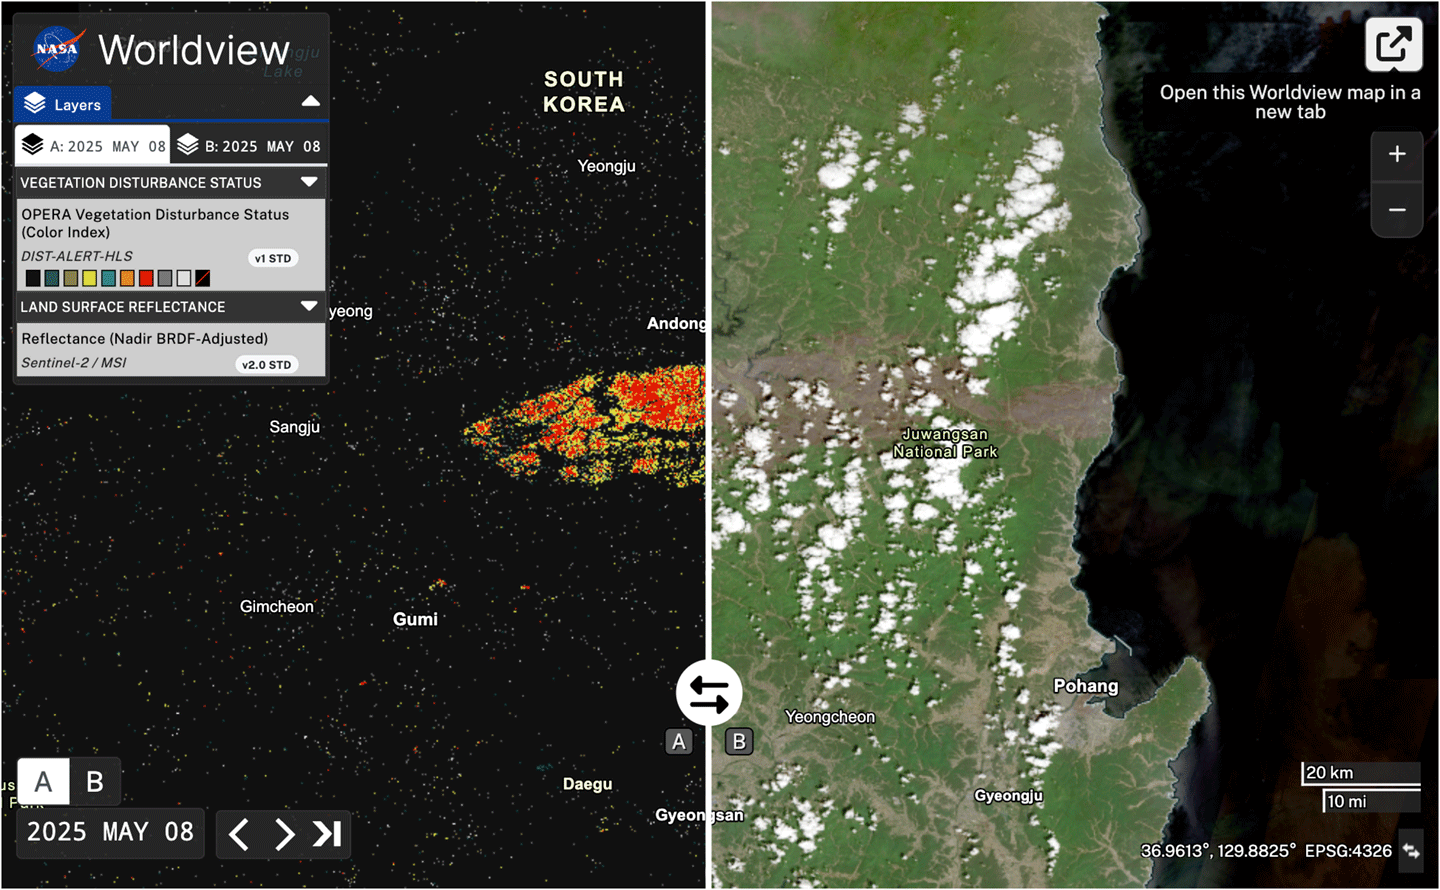
The land disturbance product (DIST-ALERT) is a global land change monitoring system that uses HLS V2.0 data to track vegetation anomalies in near real-time – see Figure 1. DIST-ALERT captures agricultural expansion, urban growth, fire, flooding, logging, drought, landslides, and other forces of change to vegetation. Amy Pickens [University of Maryland, Department of Geographical Sciences—Assistant Research Professor] said that HLS is the perfect dataset for tracking disturbances because of the frequency of observations.
DIST-ALERT was created through Observational Products for End-Users from Remote Sensing Analysis (OPERA), a project at NASA/Jet Propulsion Laboratory (JPL). OPERA products respond to agency needs identified by the SNWG. In 2018, SNWG identified tracking surface disturbance as a key need. OPERA partnered with the Global Land Analysis and Discovery (GLAD) lab at University of Maryland to develop the change detection algorithm.
To track changes in vegetation, the DIST-ALERT system establishes a rolling baseline – meaning that for any given pixel, the vegetation cover is compared against vegetation cover from the same 31-day window in the previous three years. The primary algorithm detects any vegetation loss relative to the established baseline. A secondary algorithm flags any spectral anomaly (i.e., any change in reflectance) compared to that same baseline. This approach ensures that the algorithm catches non-vegetation change (e.g., new building or road projects in unvegetated areas). Used together, these algorithms can identify long-term changes in agricultural expansion, deforestation, and urbanization alongside short-term changes in crop harvest, drought, selective logging, and the impacts of disasters. On average, DIST-ALERT is made available on LP DAAC within six hours of when new HLS data is available. Currently, the dataset does not provide attribution to disturbances.
Figure 1. In March 2025, wildfires burned through South Korea, resulting in heavy vegetation loss. [left] Output of the DIST-ALERT product on NASA Worldview from May 8, 2025, with vegetation loss in percent flagged with varying levels of confidence. Yellow and red represent areas with confirmed vegetation cover losses of <50% and ≥50%, respectively. [right] Natural-color image captured by the Multi-Spectral Instrument (MSI) aboard Sentinel-2C on May 8, 2025. The large brown burn scar in the center of the image corresponds to vegetation loss detected by DIST-ALERT. It stands in contrast to the surrounding green vegetation.
Figure credit: NASA Earthdata
Disturbance alerts already exist in some ecosystems. Brazil’s National Institute for Space Research [Instituto Nacional de Pesquisas Espaciais (INPE)] runs two projects that detect deforestation in the Amazon: Programa de Cálculo do Desflorestamento da Amazônia (PRODES) and Sistema de Detecção de Desmatamento em Tempo Real (DETER). The GLAD lab created its own forest loss alerts – GLAD-L and GLAD-S2 – using Landsat and Sentinel-2 data respectively. Global Forest Watch integrates GLAD-L and GLAD-S2 data with Radar for Detecting Deforestation (RADD) observations – derived from synthetic aperture radar data from Copernicus Sentinel-1 – into an integrated deforestation alert.
The implementation of these alert systems, some of which have been around for decades, have been shown to impact deforestation rates in the tropics. For example, a 2021 study in Nature Climate Change found that deforestation alerts decreased the probability of deforestation in Central Africa by 18% relative to the average 2011–2016 levels.
DIST-ALERT is distinct from other alert systems in a few ways. First, it has global coverage. Second, the rolling baseline allows for tracking changes in seasonality and disturbances to dynamic ecosystems. When HLS V2.0 data are input to DIST-ALERT, the system is also better at identifying disturbances in cloudy ecosystems than other individual alert systems – because it is more likely to obtain clear observations. This also enables it to identify the start and end of the disturbance more precisely.
Pickens said that the DIST-ALERT team is already working with end-users who are implementing their data product. She has spoken to some who use the system to help logging companies prove that they are complying with regulations. The U.S. Census Bureau is also using DIST-ALERT to monitor fast-growing communities so that they can do targeted assessments in the interim between the larger decennial census.
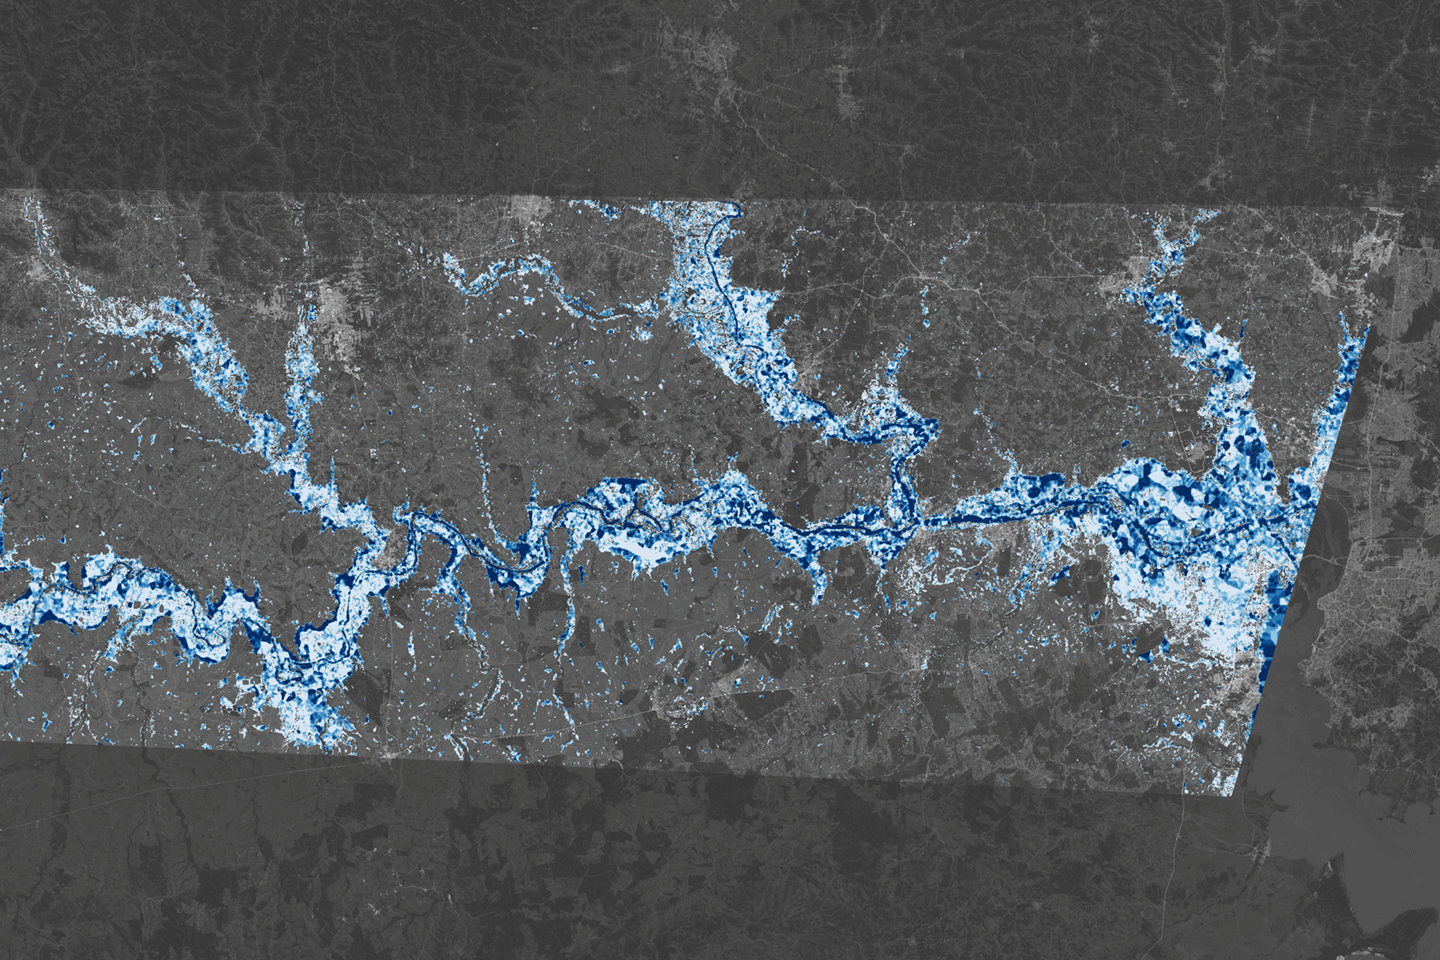
Alongside DIST-ALERT, OPERA has also been developing the Dynamic Surface Water eXtent (DSWx) product suite, which employs HLS to track surface water (e.g., lakes, reservoirs, rivers, and floods) around the globe – see Figure 2. These new products represent the new applications made possible by the HLS interagency and international collaboration.
Figure 2. The map shows flood extent and estimates of flood depth in areas west of Porto Alegre, Brazil on May 6, 2024. The flood extent is from the Observational Products for End-Users from Remote Sensing Analysis (OPERA) Dynamic Surface Water eXtent product, which uses Harmonized Landsat Sentinel-2 data. The flood depth estimate is from the Floodwater Depth Estimation Tool (FwD ET). The darkest blue areas represent floodwater at least 5 m (20 ft) deep. Much of the inundated floodplain is light blue, which equates to depths of between 0.1–1 m (4–40 in).
Figure credit: Lauren Dauphin [NASA’s Earth Observatory], Dinuke Munasinghe [JPL], Sagy Cohen [University of Alabama], and Alexander Handwerger [JPL]
Conclusion
HLS is set to continue improving land monitoring efforts across the globe. Meanwhile, the HLS science team is working to improve the algorithms for a more seamless harmonization of Landsat 8 and 9 and Sentinel-2 data. They are also working to improve the cloud-masking algorithm, have recently released vegetation indices, and are working on developing a low-latency (six-hour) HLS surface reflectance product, all while incorporating user feedback.
Looking ahead, the launch of future Sentinel and Landsat satellites will further the development of HLS. The additional data and unique capabilities will continue to meet researchers’ need for more frequent, high-quality satellite observations of Earth’s land surface.
Madeleine Gregory NASA’s Goddard Space Flight Center/Science Systems and Applications Inc. madeleine.s.gregory@nasa.gov